@zhangyy
2021-10-08T16:38:19.000000Z
字数 7457
阅读 394
关于二进制k8s1.17.16 部署kubesphere 填坑
kubernetes系列
一: 部署metric-0.3.6
下载:components.yamlwget https://github.com/kubernetes-sigs/metrics-server/releases/download/v0.3.6/components.yaml下载:k8s.gcr.io/metrics-server-amd64:v0.3.6 镜像导入主机docker load -i k8s.gcr.io/metrics-server-amd64:v0.3.6kubectl apply -f components.yamlkubectl get pod -n kube-system

二:关于metric 的报错问题
kubectl top node报错:Error from server (ServiceUnavailable): the server is currently unable to handle the request (get pods.metrics.k8s.io)参考:https://blog.csdn.net/zorsea/article/details/105037533
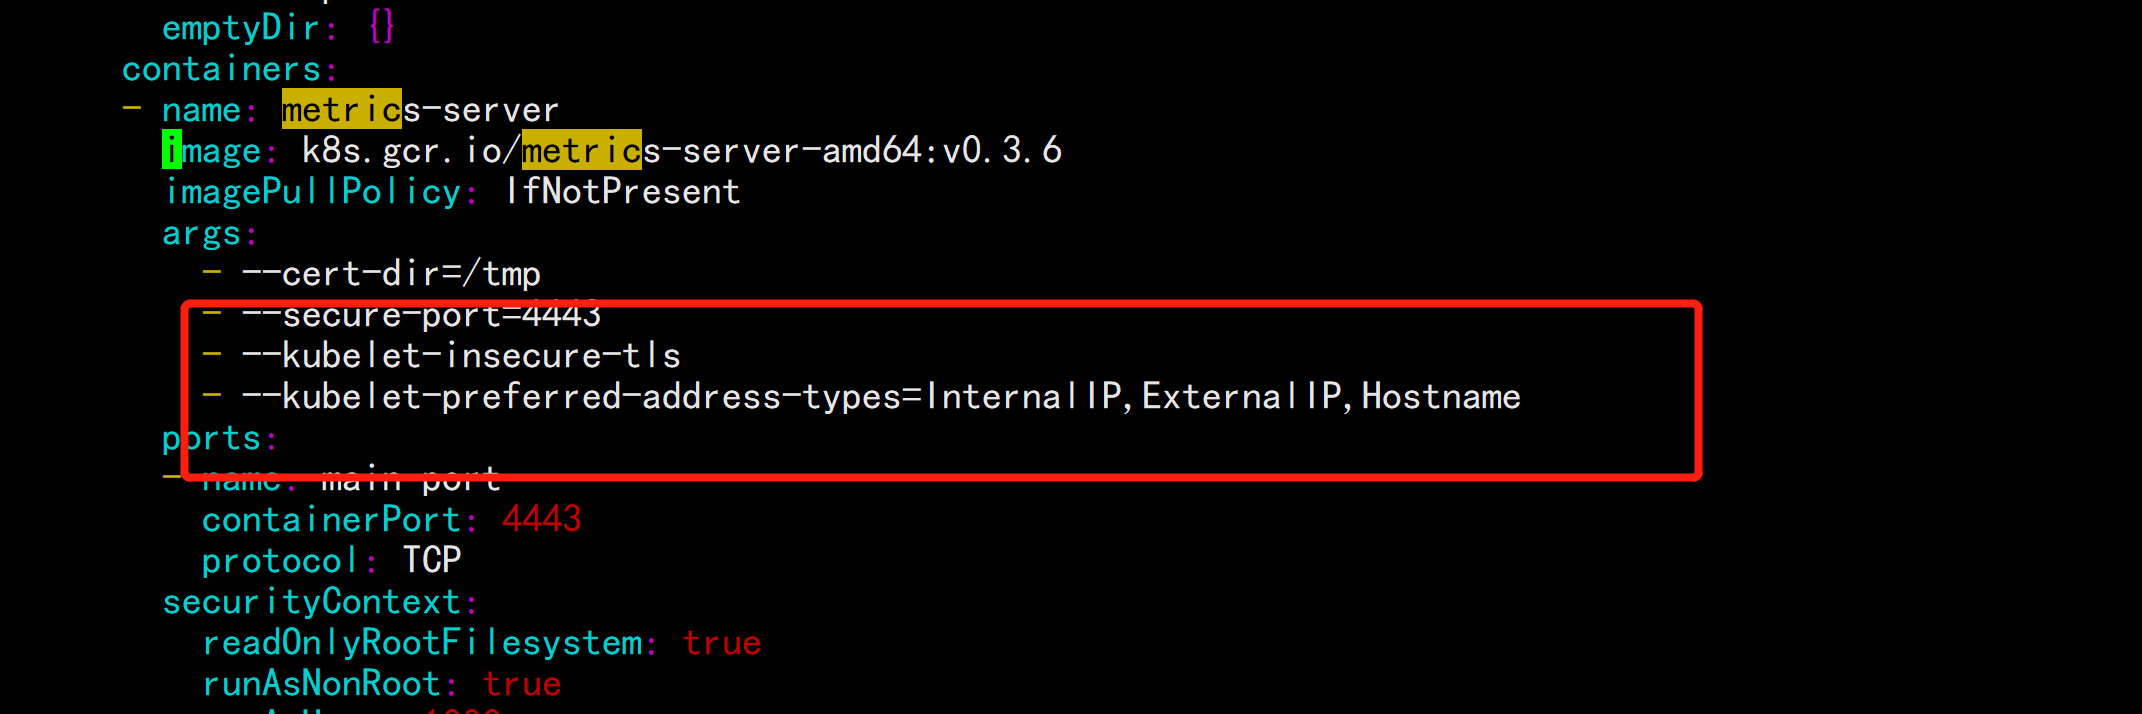
vim components.yaml---- --kubelet-insecure-tls- --kubelet-preferred-address-types=InternalIP,ExternalIP,Hostname---
生成metric 的 key 授权:vim metrics-server-csr.json---{"CN": "system:metrics-server","hosts": [],"key": {"algo": "rsa","size": 2048},"names": [{"C": "CN","ST": "BeiJing","L": "BeiJing","O": "k8s","OU": "system"}]}---cd TLS/k8s/---cfssl gencert -ca=/opt/kubernetes/ssl/ca.pem -ca-key=/opt/kubernetes/ssl/ca-key.pem -config=ca-config.json -profile=kubernetes metrics-server-csr.json | cfssljson -bare metrics-server---
cp -p metrics-server-key.pem metrics-server.pem /opt/kubernetes/ssl/同步到所有的master 节点
配置metrics-server RBAC授权cat > auth-metrics-server.yaml << EOF---apiVersion: rbac.authorization.k8s.io/v1kind: ClusterRolemetadata:name: system:auth-metrics-server-readerlabels:rbac.authorization.k8s.io/aggregate-to-view: "true"rbac.authorization.k8s.io/aggregate-to-edit: "true"rbac.authorization.k8s.io/aggregate-to-admin: "true"rules:- apiGroups: ["metrics.k8s.io"]resources: ["pods", "nodes"]verbs: ["get", "list", "watch"]---apiVersion: rbac.authorization.k8s.io/v1kind: ClusterRoleBindingmetadata:name: metrics-server:system:auth-metrics-serverroleRef:apiGroup: rbac.authorization.k8s.iokind: ClusterRolename: system:auth-metrics-server-readersubjects:- kind: Username: system:metrics-servernamespace: kube-systemEOFkubectl apply -f auth-metrics-server.yaml
在k8s 的apiserver 配置文件的当中加上 metrics 的认证:cd /opt/kubernetes/cfg/-----proxy-client-cert-file=/opt/kubernetes/ssl/metrics-server.pem --proxy-client-key-file=/opt/kubernetes/ssl/metrics-server-key.pem---然后重启kubeapiserve

kubectl create clusterrolebinding system:anonymous --clusterrole=cluster-admin --user=system:anonymous
保证kubectl top node

安装 kubesphere
https://kubesphere.com.cn/docs/quick-start/minimal-kubesphere-on-k8s/wget https://github.com/kubesphere/ks-installer/releases/download/v3.0.0/kubesphere-installer.yamlwget https://github.com/kubesphere/ks-installer/releases/download/v3.0.0/cluster-configuration.yaml

vim cluster-configuration.yaml----apiVersion: installer.kubesphere.io/v1alpha1kind: ClusterConfigurationmetadata:name: ks-installernamespace: kubesphere-systemlabels:version: v3.0.0spec:persistence:storageClass: "" # If there is not a default StorageClass in your cluster, you need to specify an existing StorageClass here.authentication:jwtSecret: "" # Keep the jwtSecret consistent with the host cluster. Retrive the jwtSecret by executing "kubectl -n kubesphere-system get cm kubesphere-config -o yaml | grep -v "apiVersion" | grep jwtSecret" on the host cluster.etcd:monitoring: true # Whether to enable etcd monitoring dashboard installation. You have to create a secret for etcd before you enable it.endpointIps: 192.168.100.11 # etcd cluster EndpointIps, it can be a bunch of IPs here.port: 2379 # etcd porttlsEnable: truecommon:mysqlVolumeSize: 20Gi # MySQL PVC size.minioVolumeSize: 20Gi # Minio PVC size.etcdVolumeSize: 20Gi # etcd PVC size.openldapVolumeSize: 2Gi # openldap PVC size.redisVolumSize: 2Gi # Redis PVC size.es: # Storage backend for logging, events and auditing.# elasticsearchMasterReplicas: 1 # total number of master nodes, it's not allowed to use even number# elasticsearchDataReplicas: 1 # total number of data nodes.elasticsearchMasterVolumeSize: 4Gi # Volume size of Elasticsearch master nodes.elasticsearchDataVolumeSize: 20Gi # Volume size of Elasticsearch data nodes.logMaxAge: 7 # Log retention time in built-in Elasticsearch, it is 7 days by default.elkPrefix: logstash # The string making up index names. The index name will be formatted as ks-<elk_prefix>-log.console:enableMultiLogin: true # enable/disable multiple sing on, it allows an account can be used by different users at the same time.port: 30880alerting: # (CPU: 0.3 Core, Memory: 300 MiB) Whether to install KubeSphere alerting system. It enables Users to customize alerting policies to send messages to receivers in time with different time intervals and alerting levels to choose from.enabled: trueauditing: # Whether to install KubeSphere audit log system. It provides a security-relevant chronological set of records,recording the sequence of activities happened in platform, initiated by different tenants.enabled: truedevops: # (CPU: 0.47 Core, Memory: 8.6 G) Whether to install KubeSphere DevOps System. It provides out-of-box CI/CD system based on Jenkins, and automated workflow tools including Source-to-Image & Binary-to-Image.enabled: truejenkinsMemoryLim: 2Gi # Jenkins memory limit.jenkinsMemoryReq: 1500Mi # Jenkins memory request.jenkinsVolumeSize: 8Gi # Jenkins volume size.jenkinsJavaOpts_Xms: 512m # The following three fields are JVM parameters.jenkinsJavaOpts_Xmx: 512mjenkinsJavaOpts_MaxRAM: 2gevents: # Whether to install KubeSphere events system. It provides a graphical web console for Kubernetes Events exporting, filtering and alerting in multi-tenant Kubernetes clusters.enabled: trueruler:enabled: truereplicas: 2logging: # (CPU: 57 m, Memory: 2.76 G) Whether to install KubeSphere logging system. Flexible logging functions are provided for log query, collection and management in a unified console. Additional log collectors can be added, such as Elasticsearch, Kafka and Fluentd.enabled: truelogsidecarReplicas: 2metrics_server: # (CPU: 56 m, Memory: 44.35 MiB) Whether to install metrics-server. IT enables HPA (Horizontal Pod Autoscaler).enabled: falsemonitoring:# prometheusReplicas: 1 # Prometheus replicas are responsible for monitoring different segments of data source and provide high availability as well.prometheusMemoryRequest: 400Mi # Prometheus request memory.prometheusVolumeSize: 20Gi # Prometheus PVC size.# alertmanagerReplicas: 1 # AlertManager Replicas.multicluster:clusterRole: none # host | member | none # You can install a solo cluster, or specify it as the role of host or member cluster.networkpolicy: # Network policies allow network isolation within the same cluster, which means firewalls can be set up between certain instances (Pods).# Make sure that the CNI network plugin used by the cluster supports NetworkPolicy. There are a number of CNI network plugins that support NetworkPolicy, including Calico, Cilium, Kube-router, Romana and Weave Net.enabled: truenotification: # Email Notification support for the legacy alerting system, should be enabled/disabled together with the above alerting option.enabled: trueopenpitrix: # (2 Core, 3.6 G) Whether to install KubeSphere Application Store. It provides an application store for Helm-based applications, and offer application lifecycle management.enabled: trueservicemesh: # (0.3 Core, 300 MiB) Whether to install KubeSphere Service Mesh (Istio-based). It provides fine-grained traffic management, observability and tracing, and offer visualization for traffic topology.enabled: true----kubectl apply -f kubesphere-installer.yamlkubectl apply -f cluster-configuration1.yaml

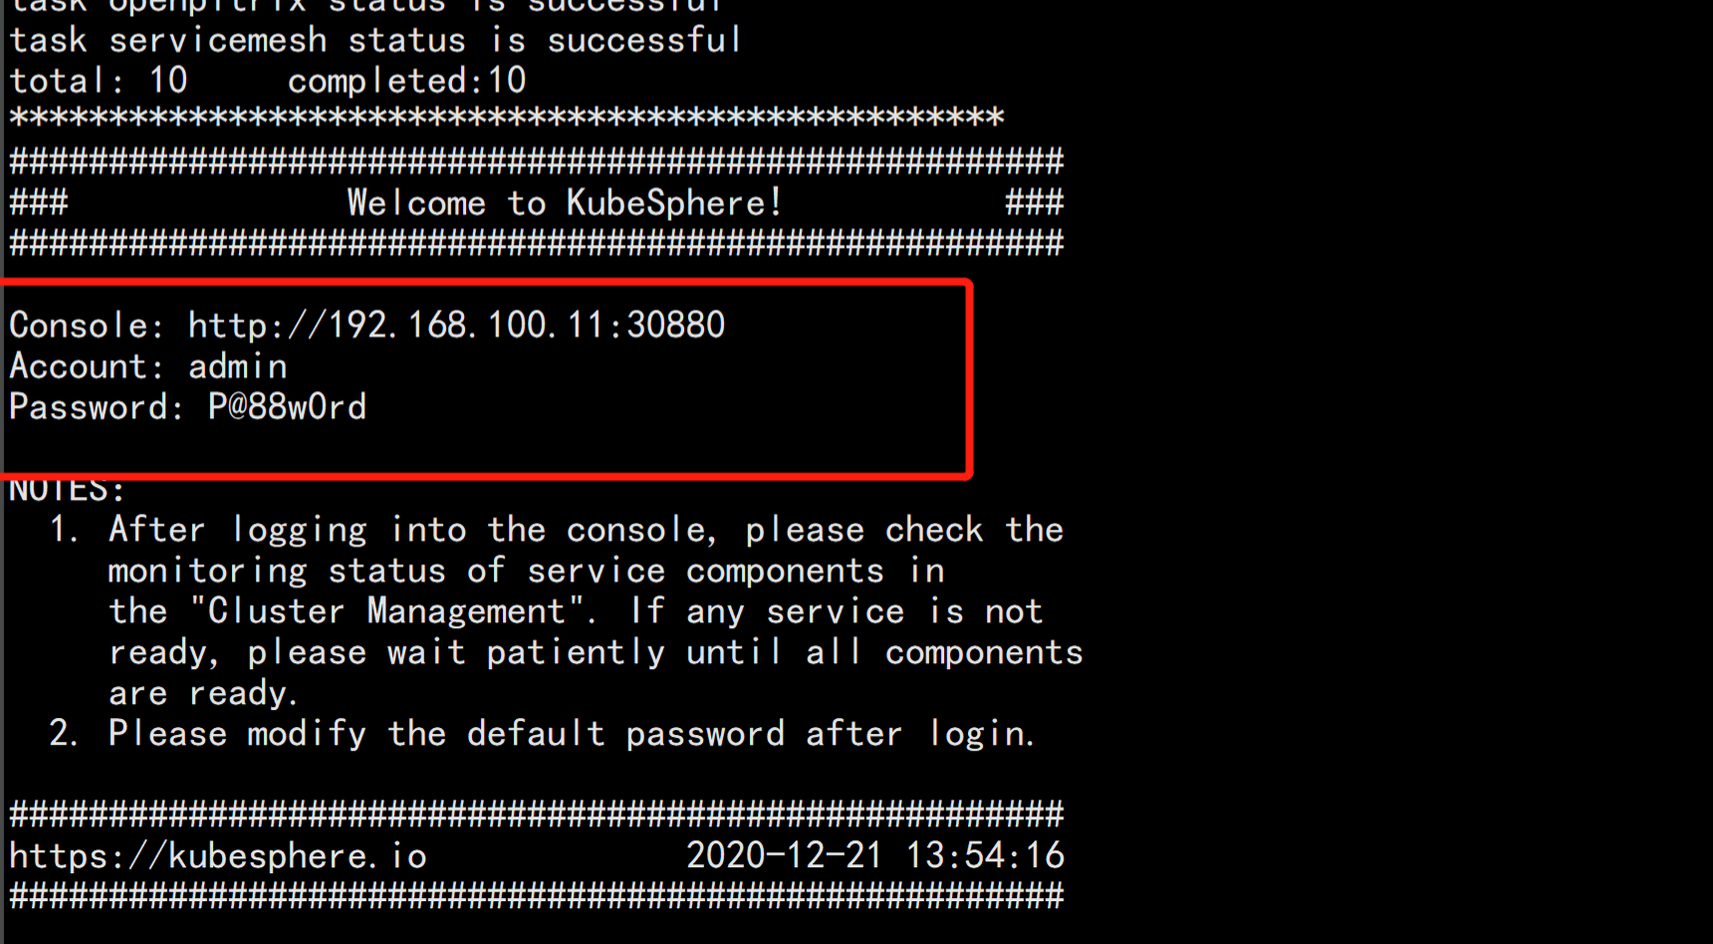
查看安装进度:kubectl logs -n kubesphere-system $(kubectl get pod -n kubesphere-system -l app=ks-install -o jsonpath='{.items[0].metadata.name}') -f

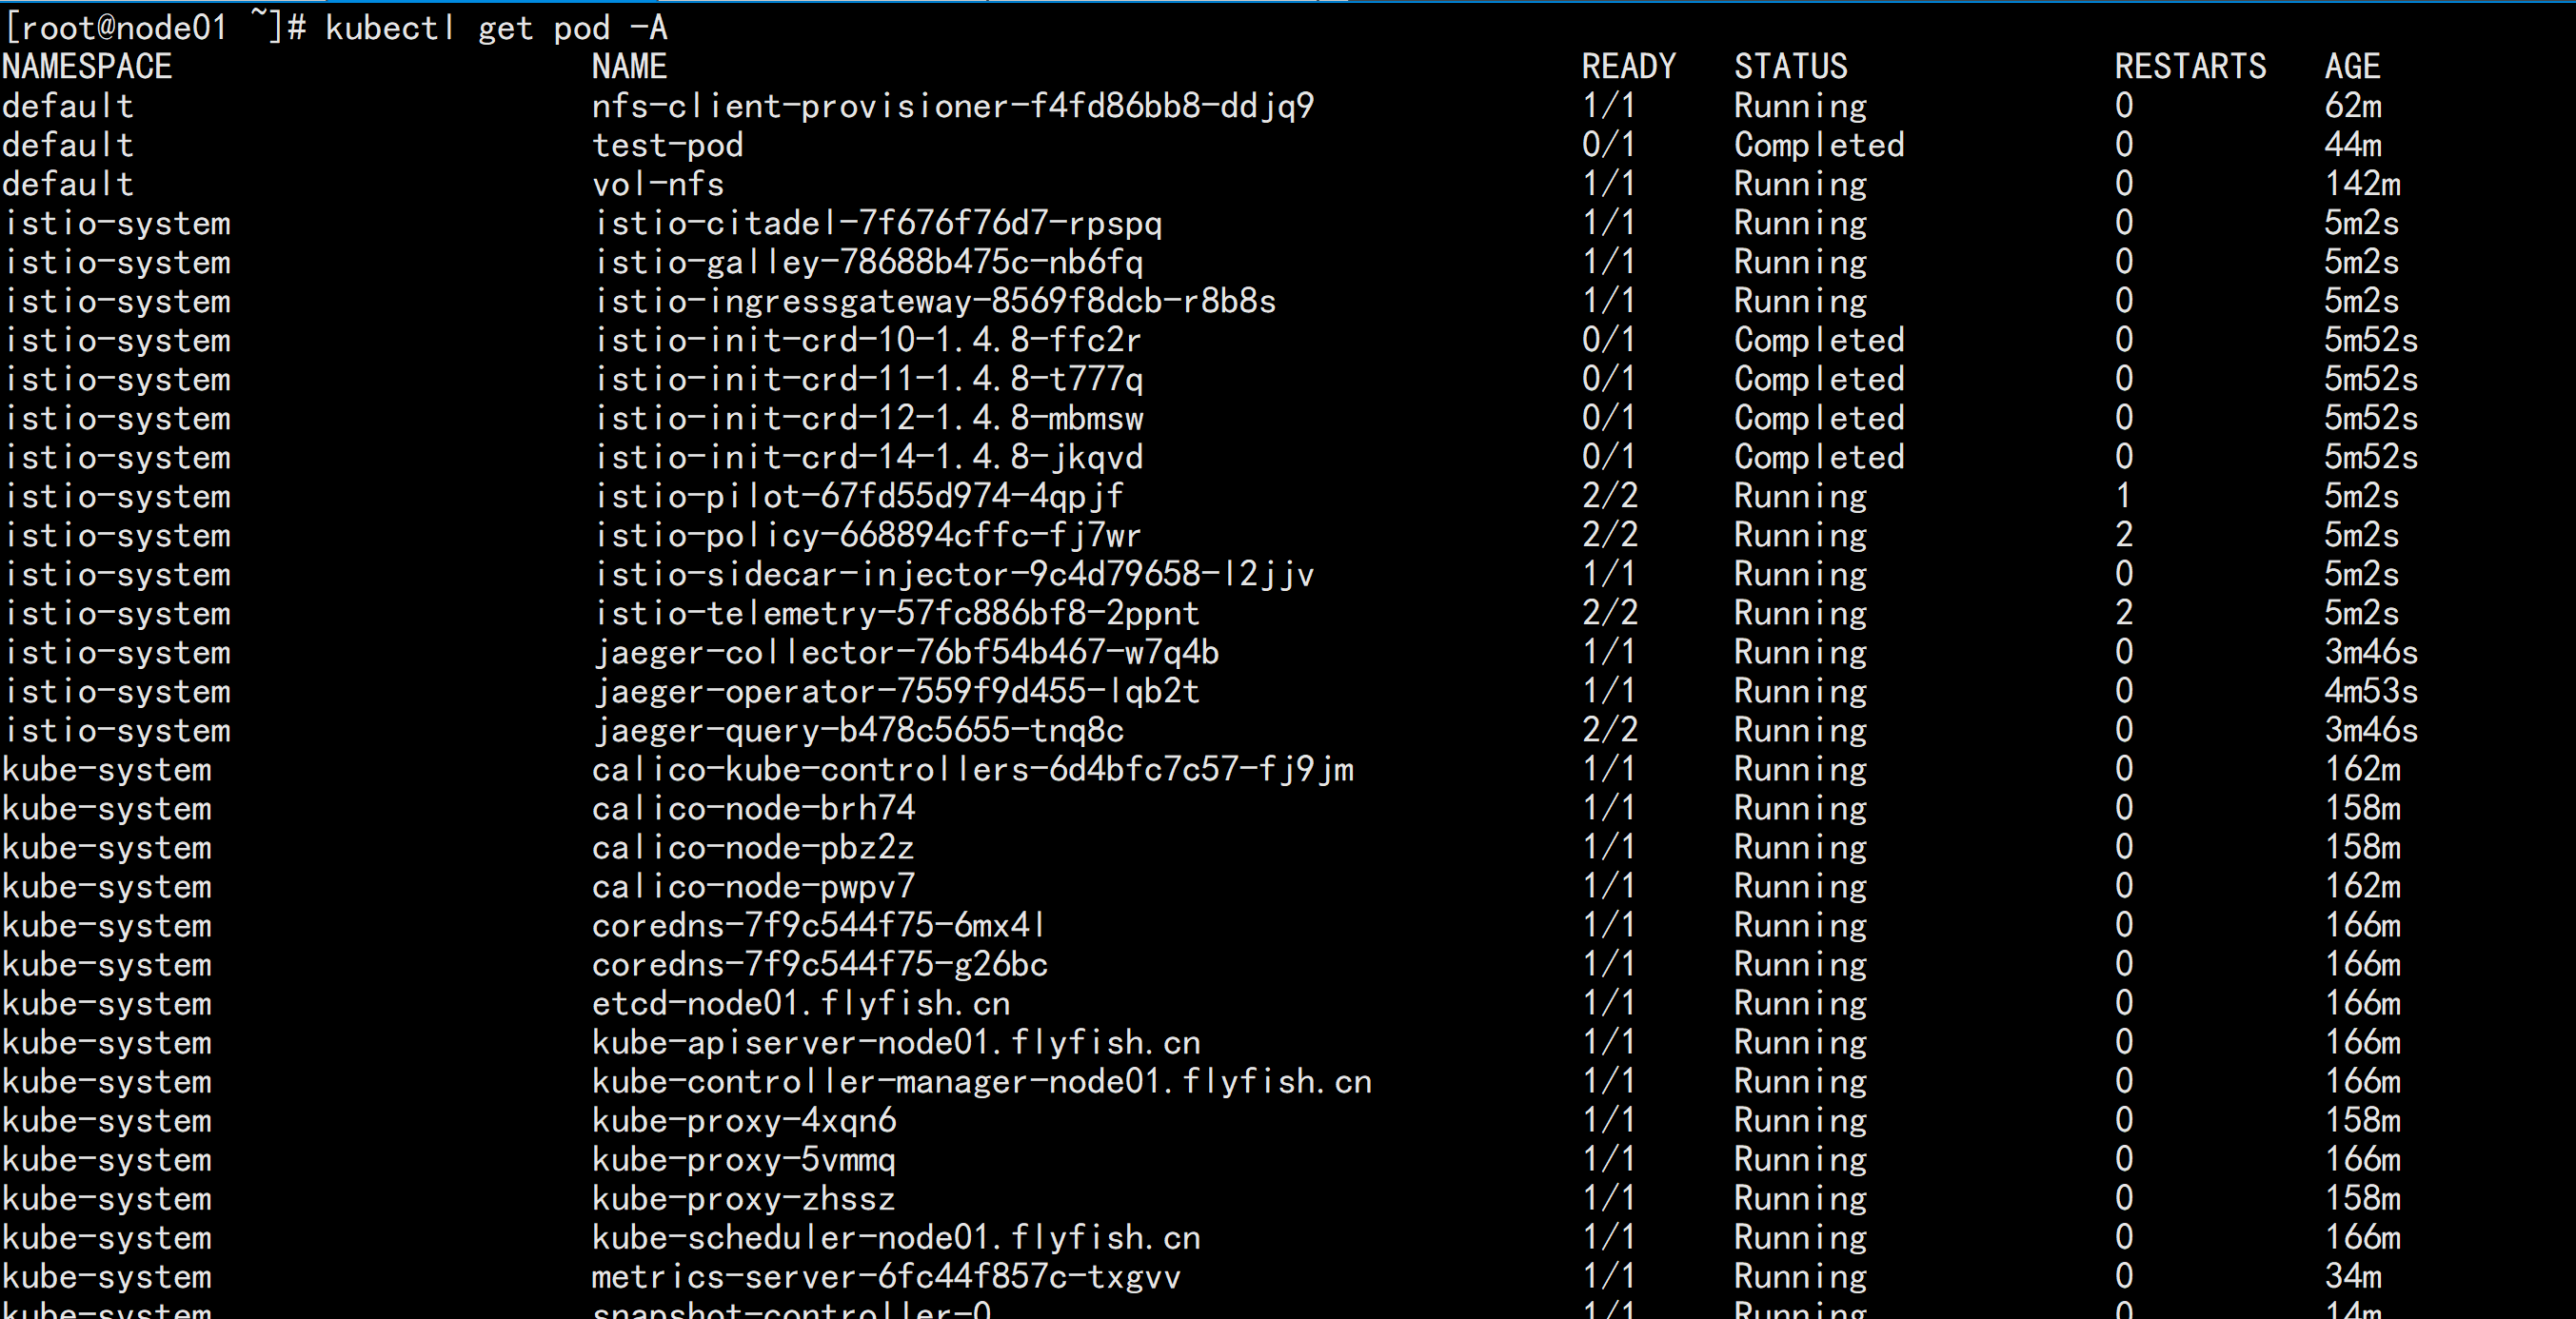
kubectl get pod -A
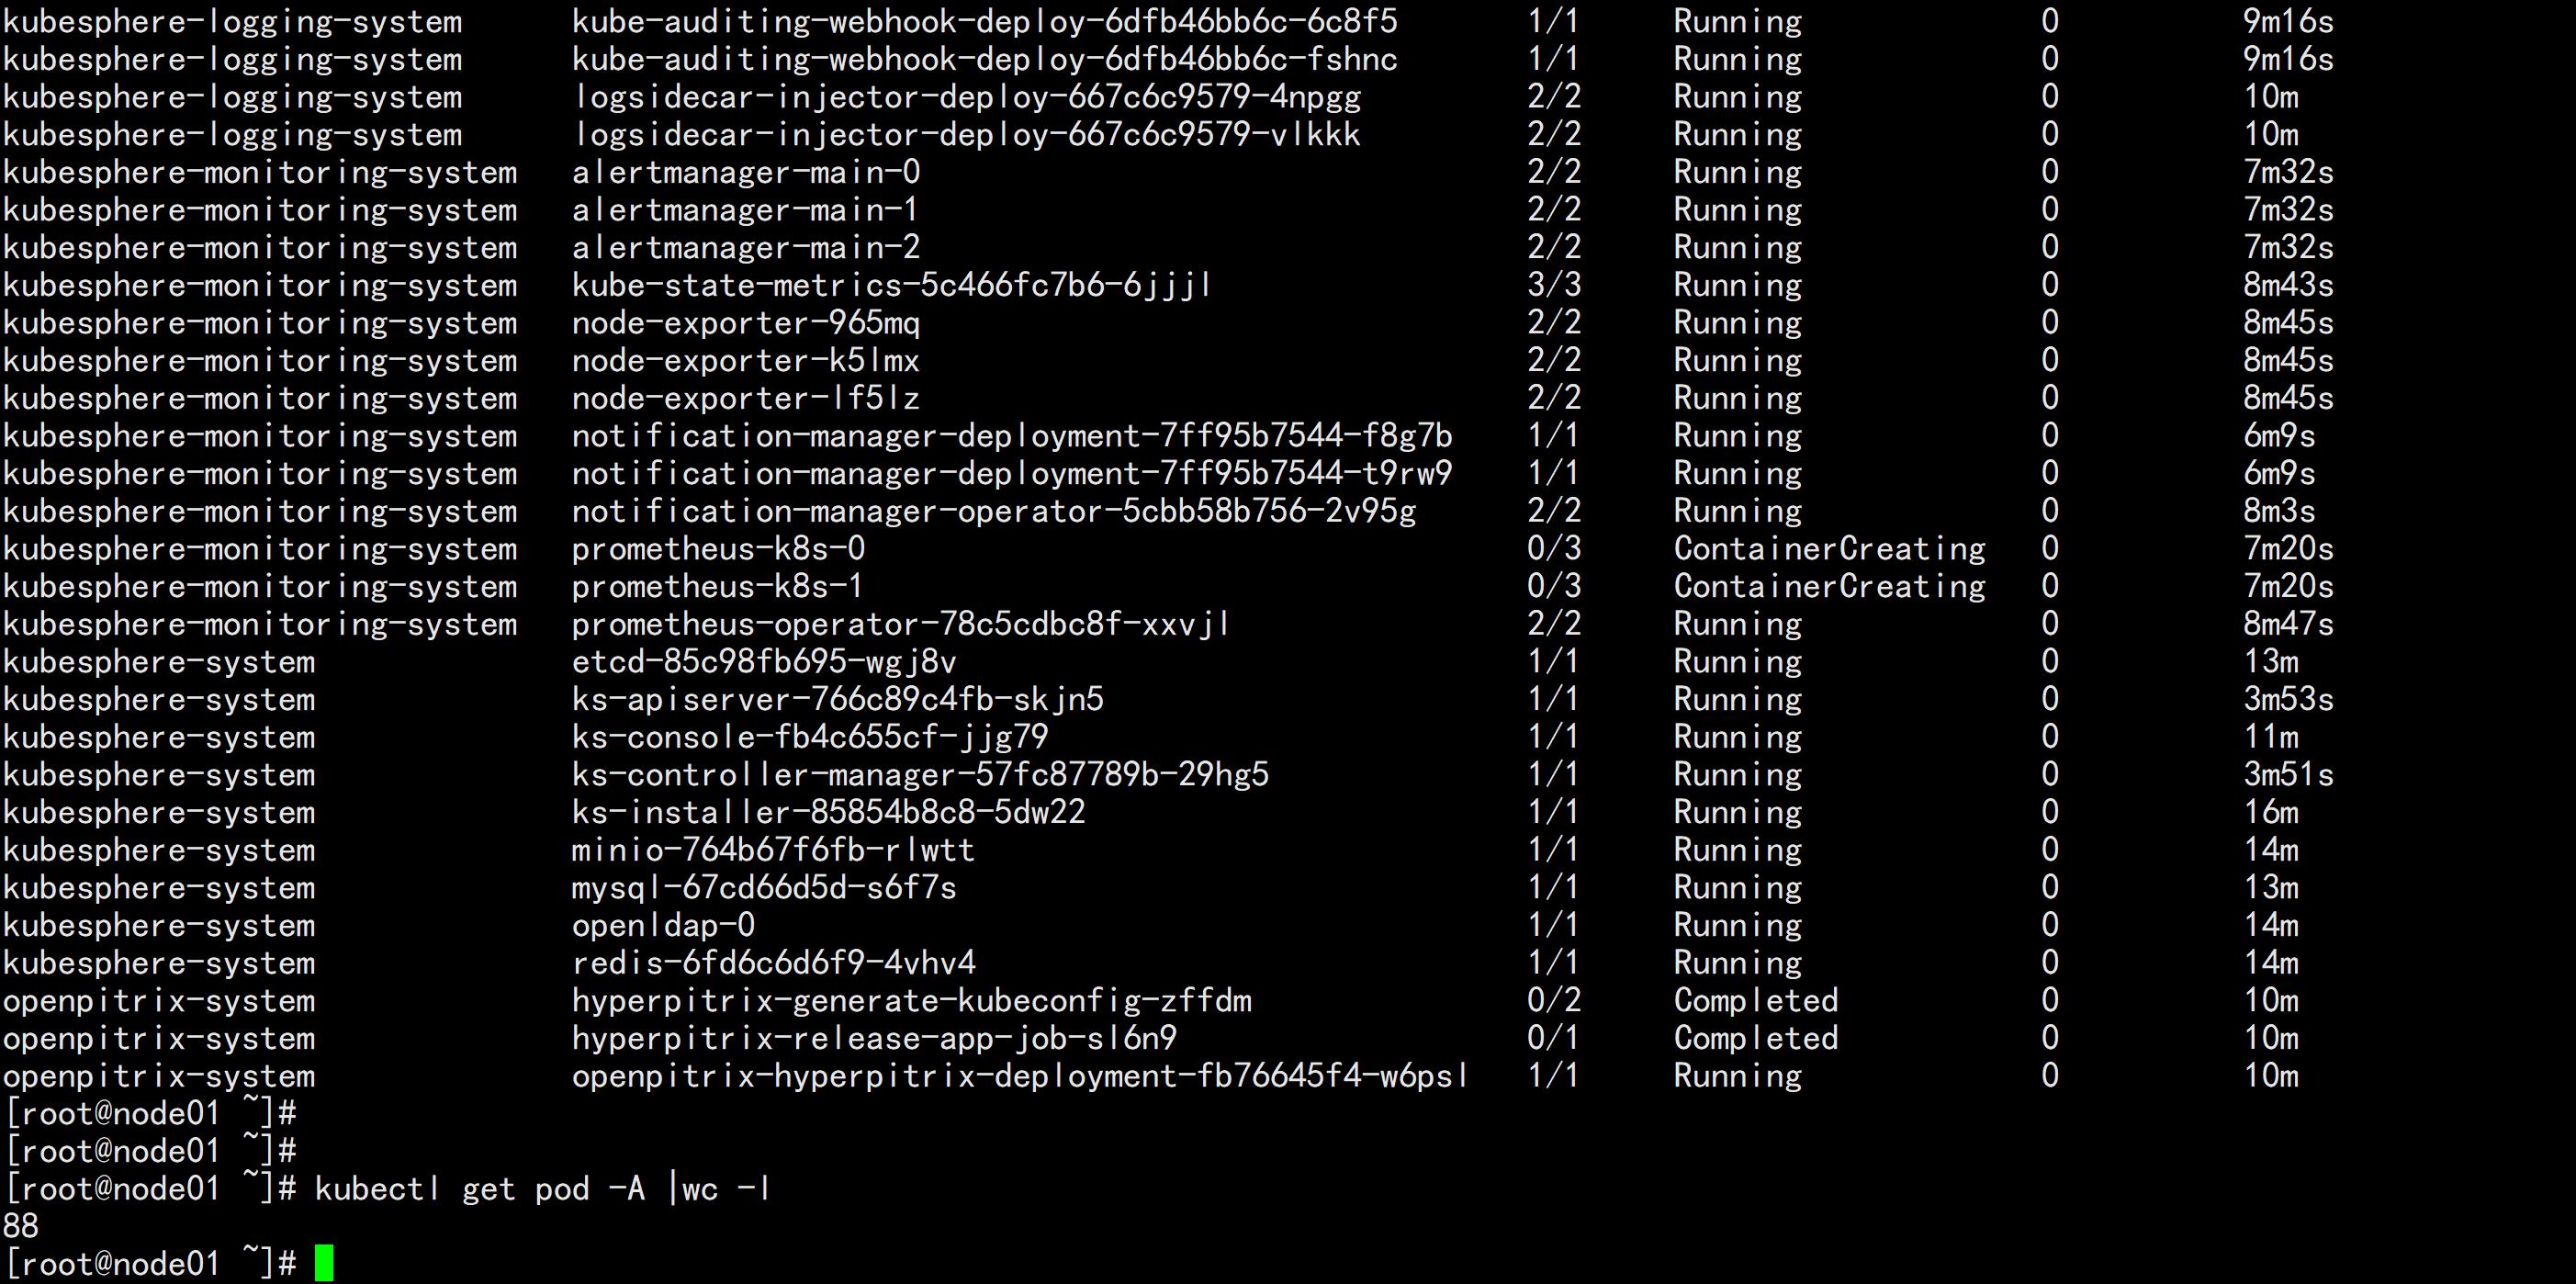
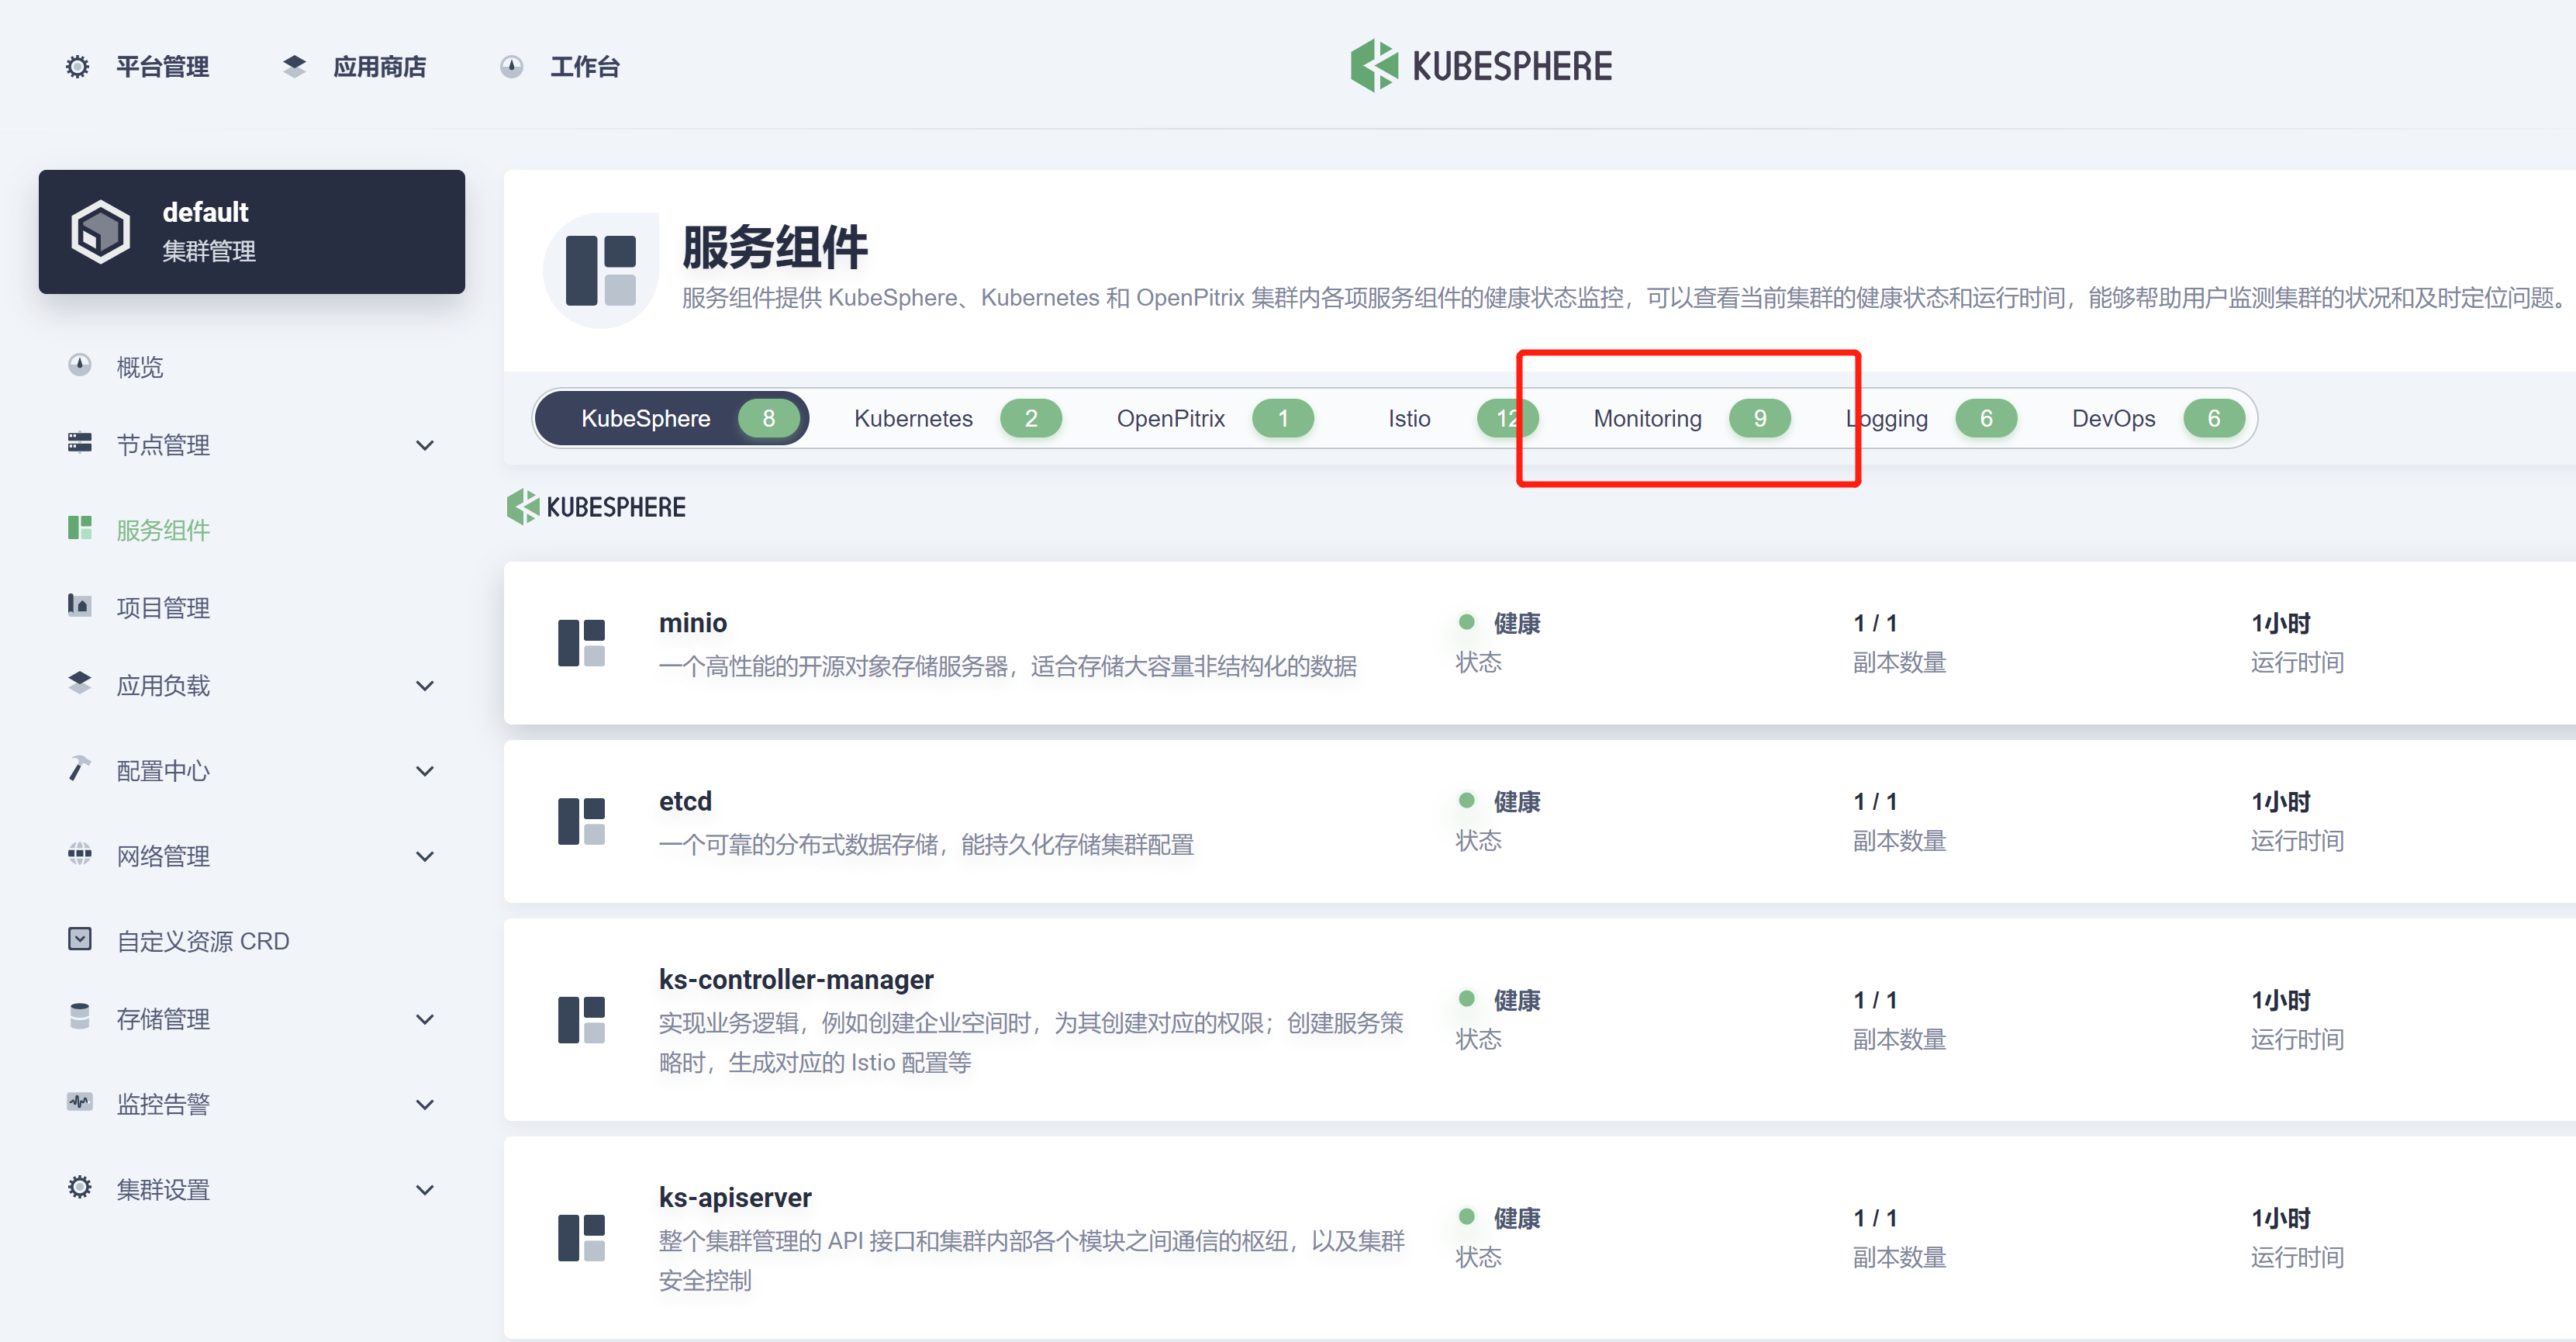
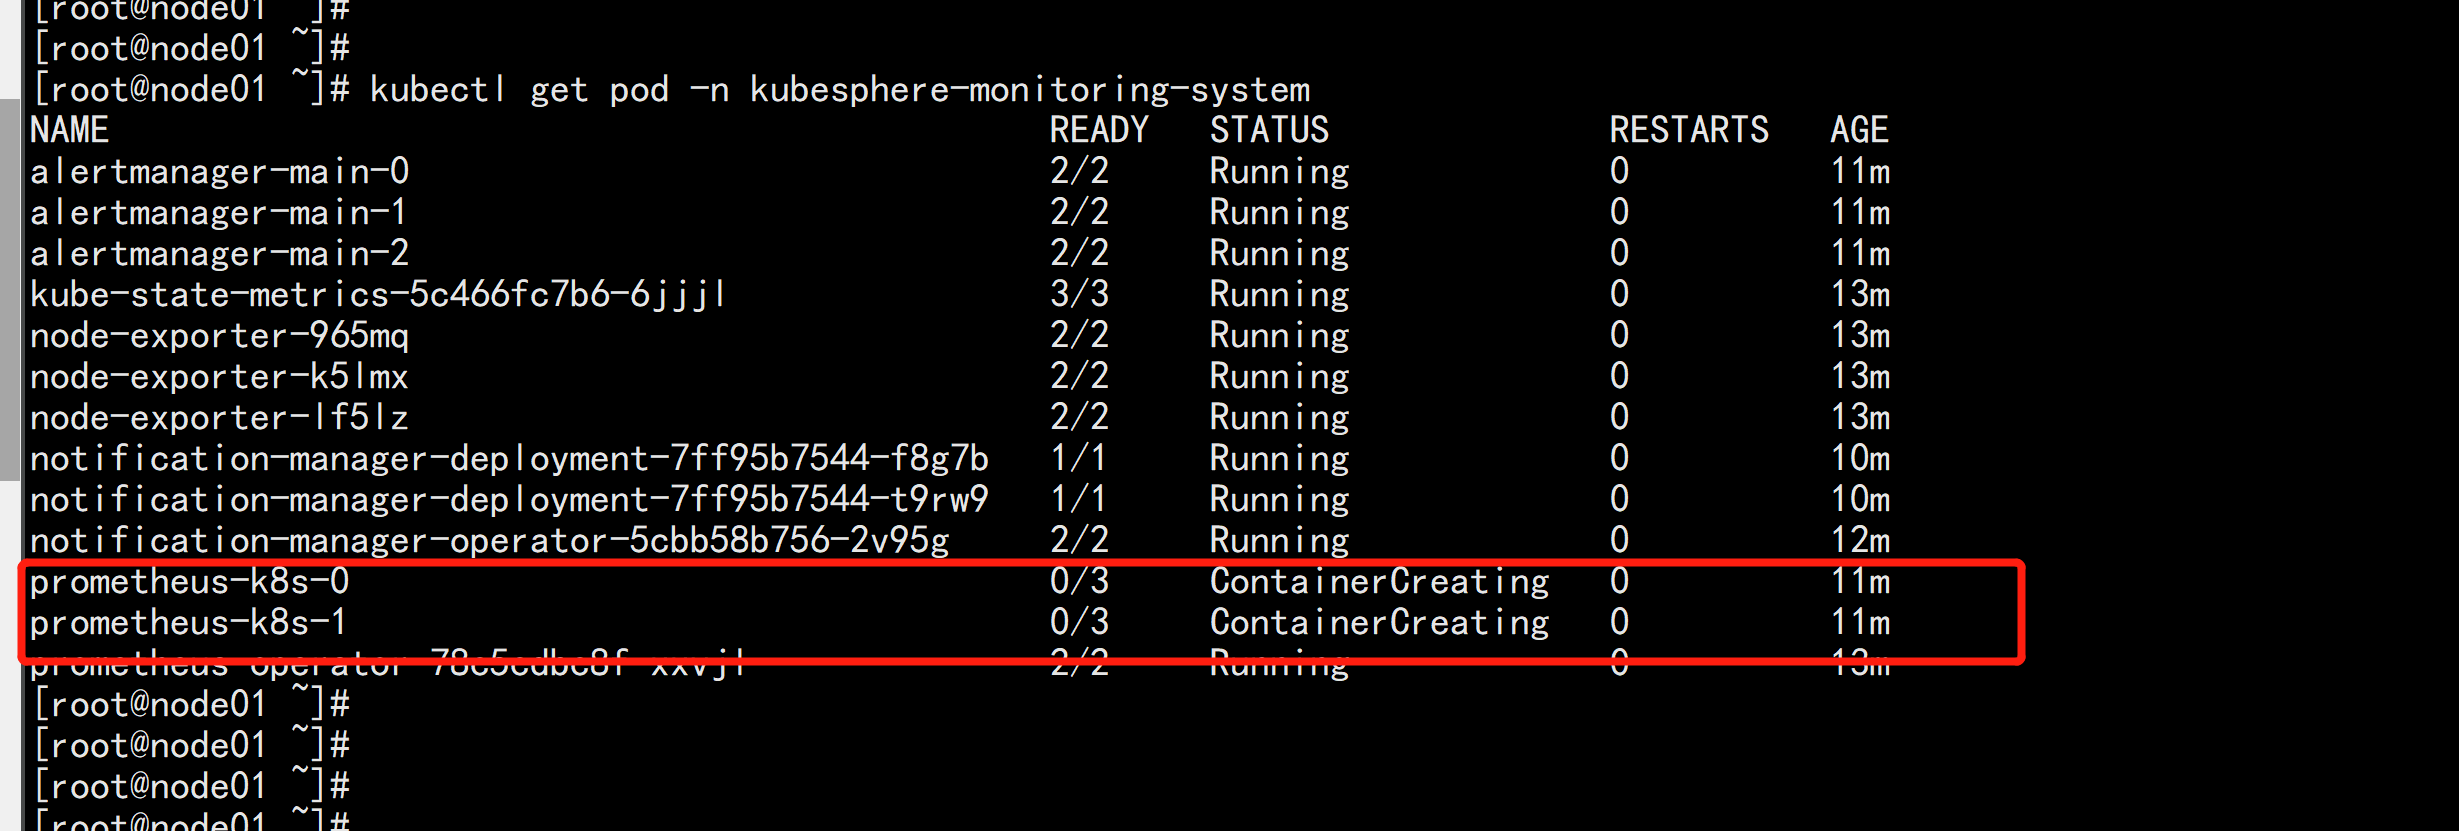
kubesphere-monitoring-system prometheus-k8s-0 0/3 ContainerCreating 0 7m20skubesphere-monitoring-system prometheus-k8s-1 0/3 ContainerCreating 0 7m20sprometheus-k8s-1 这个一直在 ContainerCreating 这个 状态
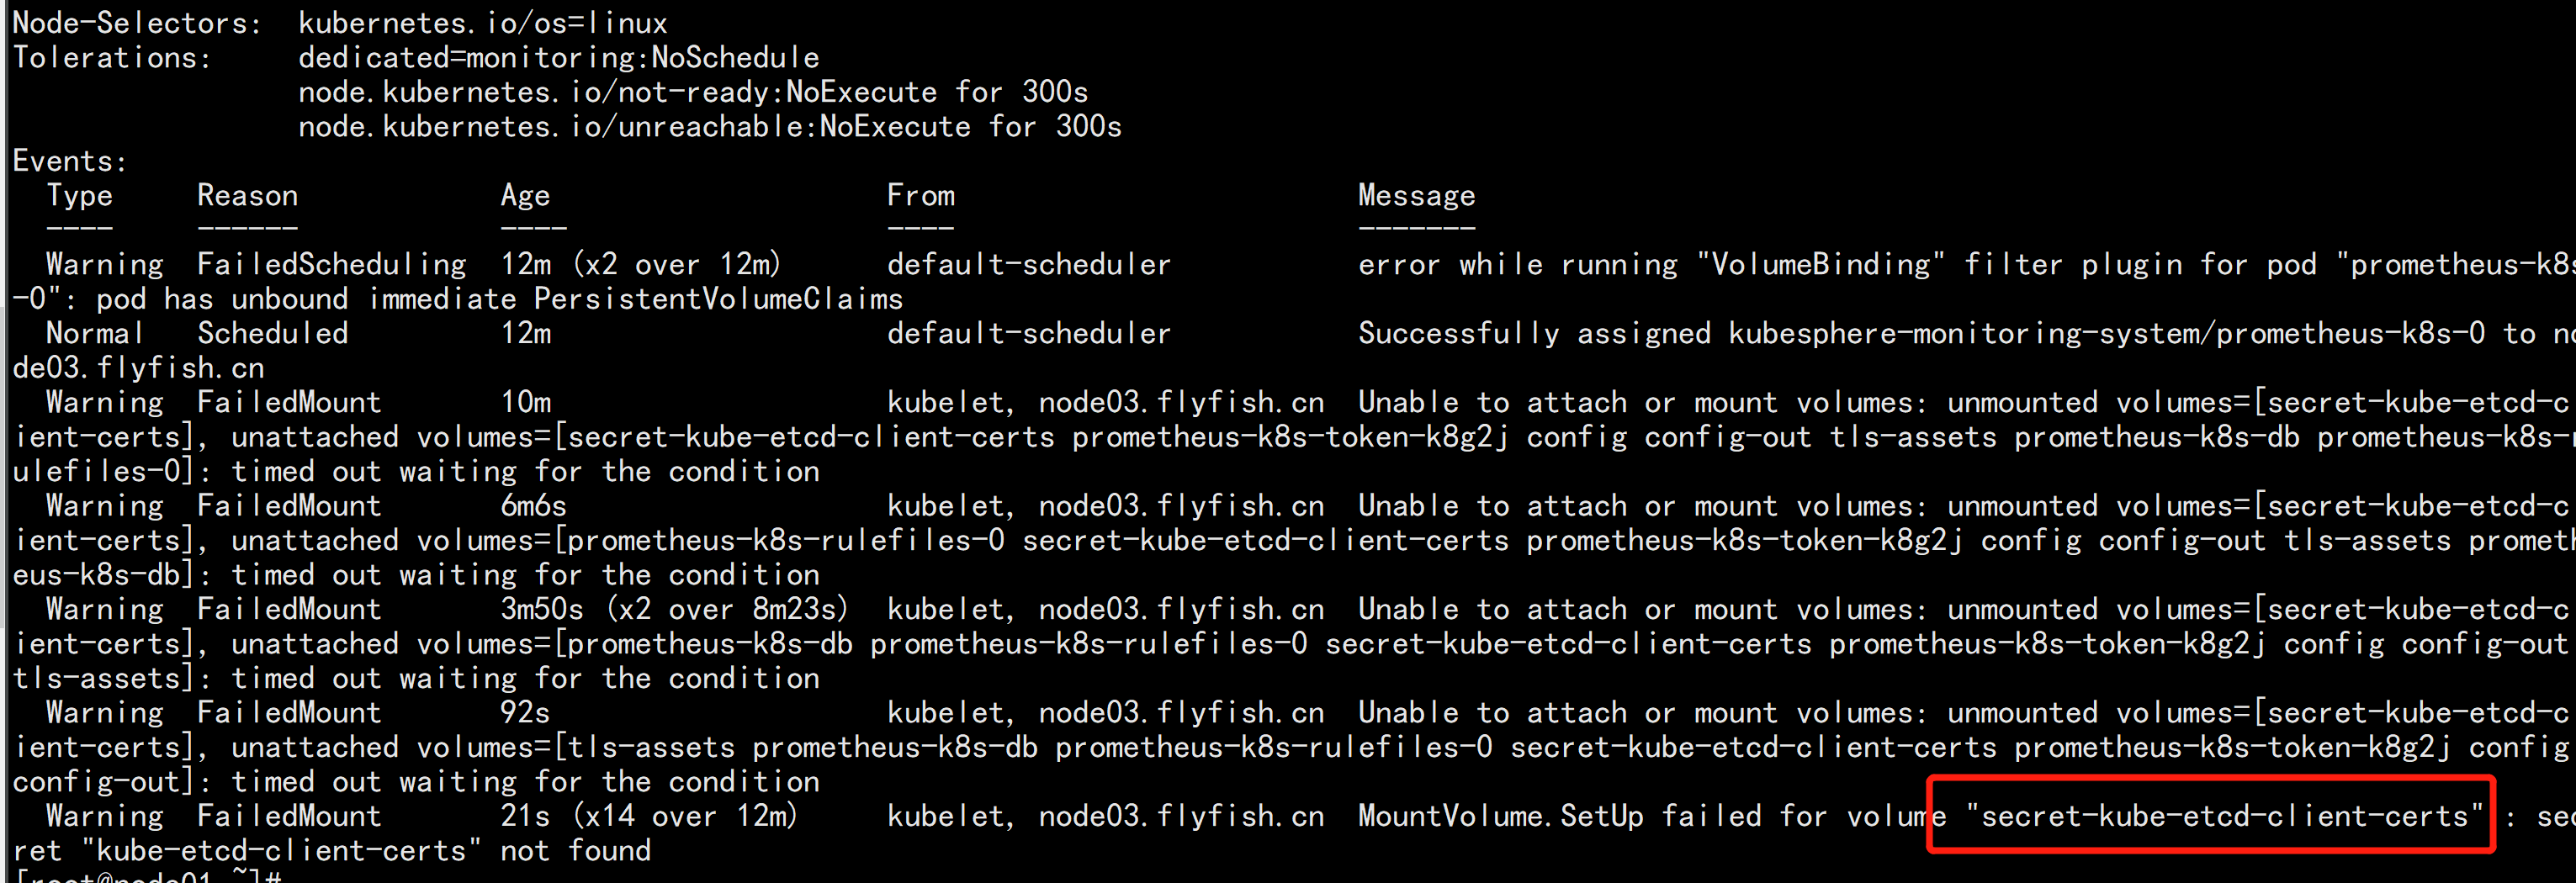
kubectl describe pod prometheus-k8s-0 -n kubesphere-monitoring-systemkube-etcd-client-certs 这个证书没有找到:
kubectl -n kubesphere-monitoring-system create secret generic kube-etcd-client-certs \--from-file=etcd-client-ca.crt=/opt/etcd/ssl/ca.pem \--from-file=etcd-client.crt=/opt/etcd/ssl/ca-key.pem
kubectl get pod -n kubesphere-monitoring-system

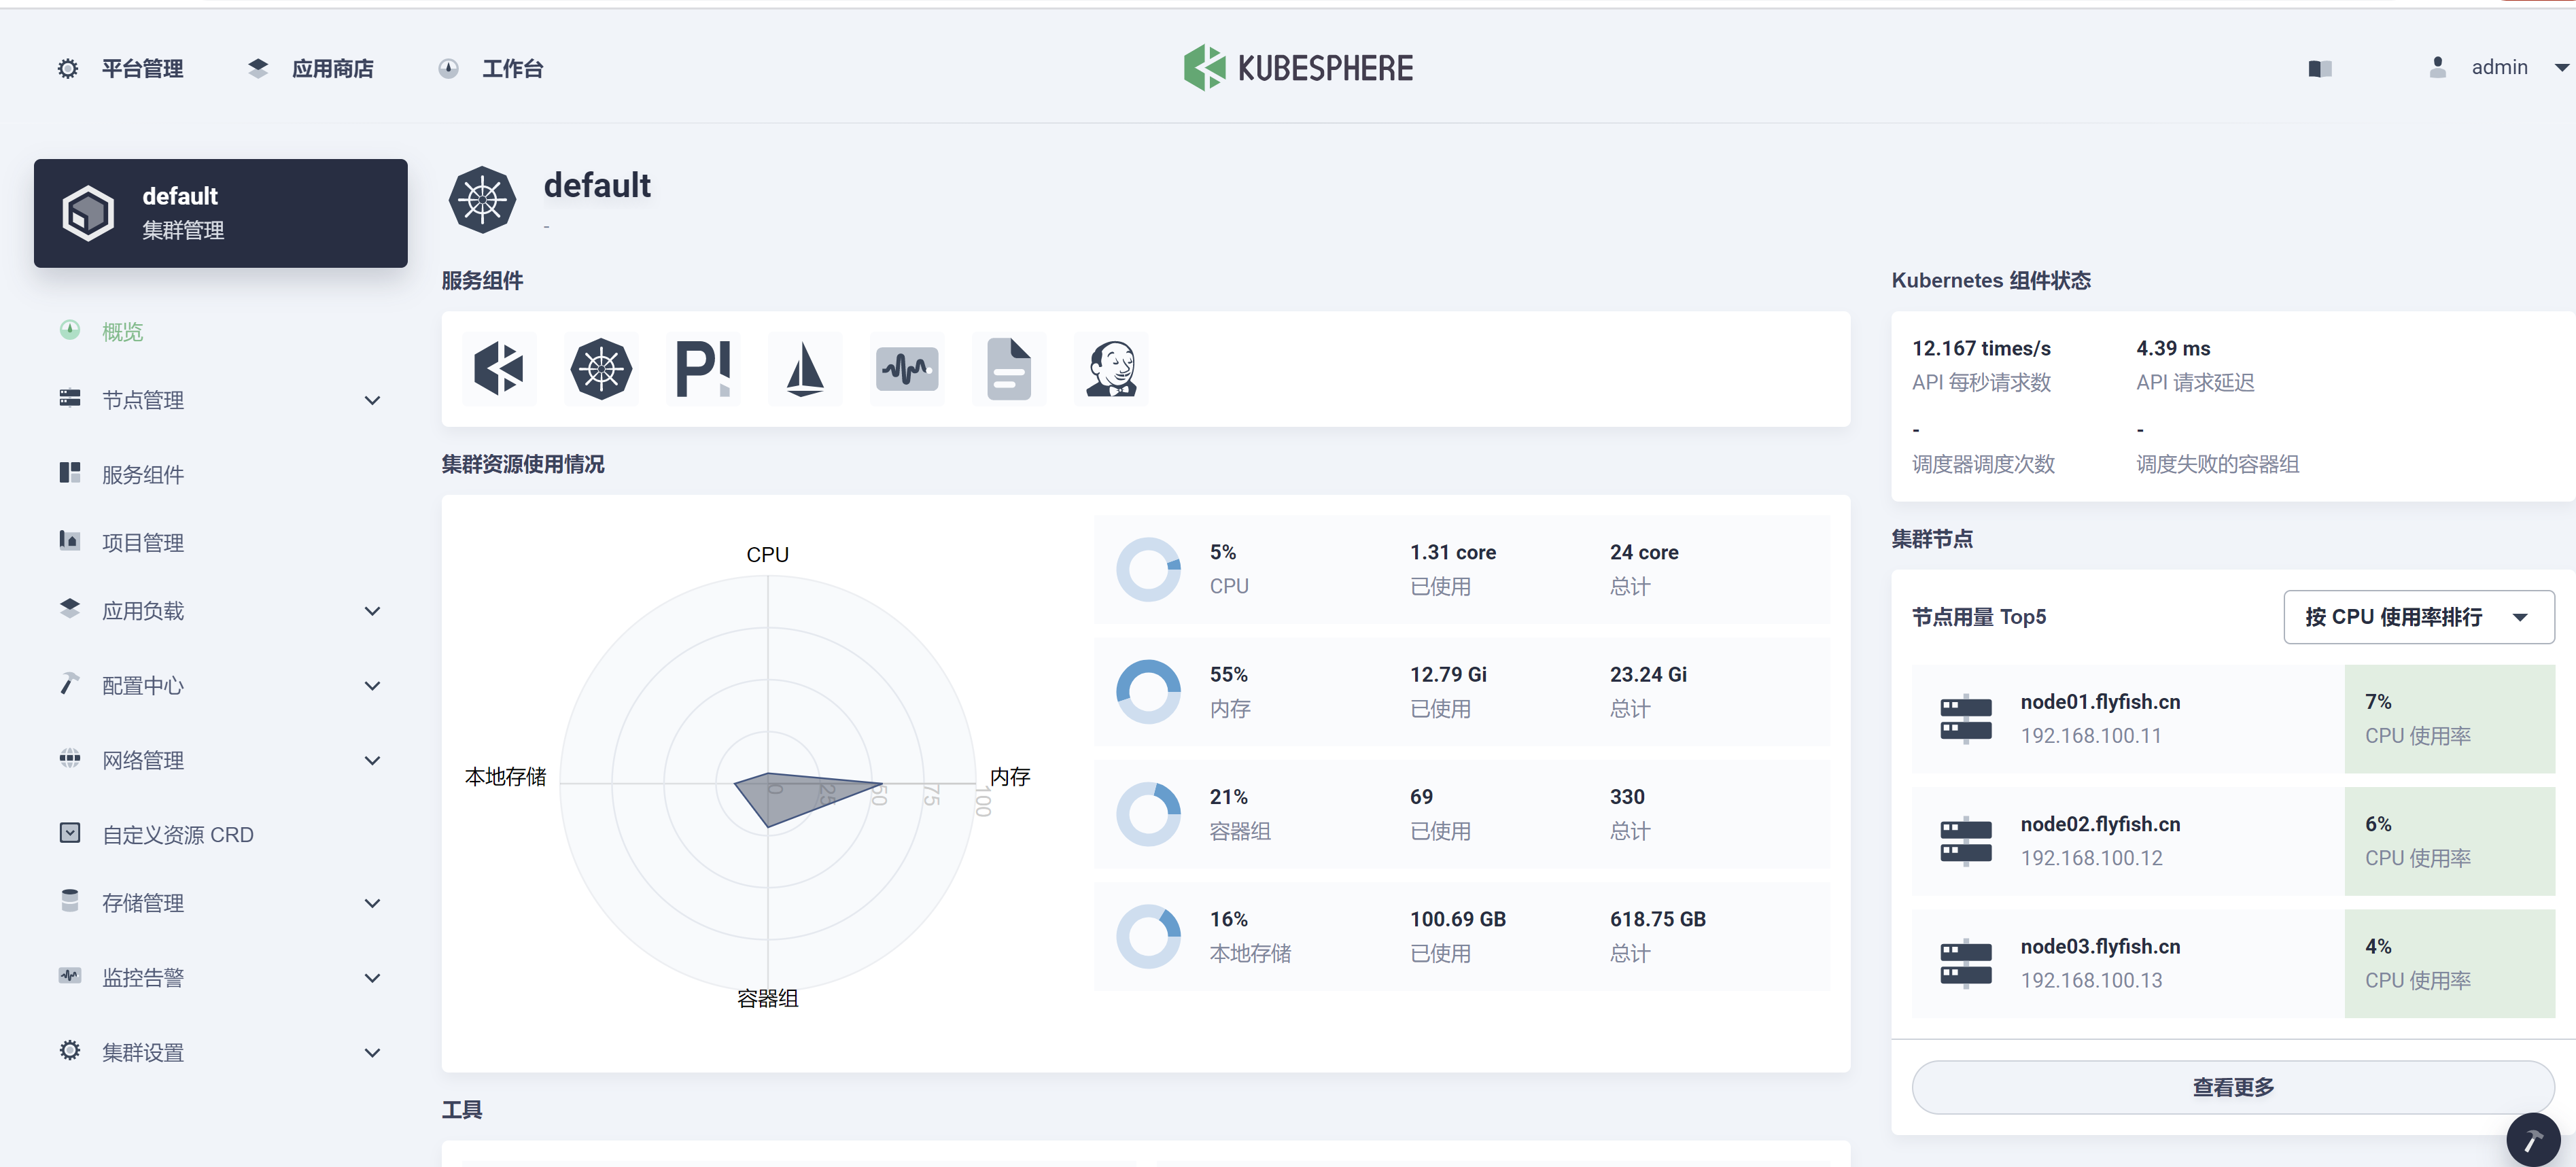
参考 日志 打开 页面:kubectl logs -n kubesphere-system $(kubectl get pod -n kubesphere-system -l app=ks-install -o jsonpath='{.items[0].metadata.name}') -f
