@zhangyy
2020-11-09T02:04:42.000000Z
字数 9405
阅读 724
Prometheus监控实战(一)
Prometheus系列
一:Prometheus是啥?
Prometheus是一个开源的系统监控和告警工具包,最初由SoundCloud开发。自2012年开始,许多公司和组织开始使用了Prometheus,该项目拥有非常活跃的开发者和用户社区。Prometheus现在是一个独立的开源项目,独立于任何公司进行维护。为了强调这一点,并澄清项目的治理结构,Prometheus在2016年加入了云原生计算基金会(CNCF),成为继Kubernetes之后的第二个托管项目,也是从CNCF第二个毕业的项目。
二:Prometheus的主要特征:
1、Prometheus使用的是 度量(metric)名称和键/值对标签(label)的时间序列数据,是一种多维的数据模型。2、PromQL是一种灵活的查询语言,可以利用度量(metric)名称和标签进行查询、聚合。3、不依赖于分布式存储,单个Prometheus服务也是自治理的。4、使用基于HTTP的拉(pull)模型进行时间序列的数据收集。5、同时也支持通过一个中间网关(pushgateway)来推送时间序列。6、目标对象(主机)是通过静态配置或者服务发现来添加的。7、支持多种图形模式和仪表盘。
三、Prometheus组件
Prometheus目前已经是一个生态系统,具有众多的可选组件。1、Prometheus Server 本身用于抓取并存储时间序列数据。2、客户端程序库用于检测各种编程语言编写的程序代码。3、pushgateway用于支持短生命周期(short-lived)的作业(job)。4、可以针对不同的服务提供对应的导出器(exporters)用于采集度量数据,如HAProxy、MySQL等服务。5、用于告警的alertmanager组件6、各种支持工具。备注:大多数Prometheus组件都是用Go编写的,这使得它们很容易以静态二进制文件的形式构建和部署。
四、Prometheus架构以及应用场景
Prometheus架构和生态组件如下图所示:
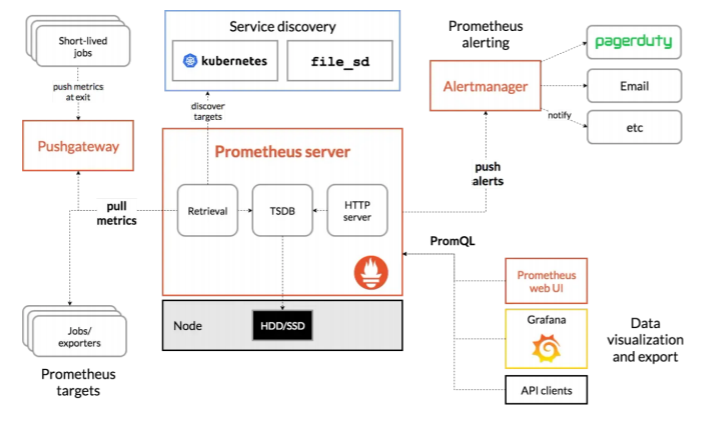
从上述架构图我们可以知道,Prometheus通过从Jobs/exporters中拉取度量数据;而短周期的jobs在结束前可以先将度量数据推送到网关(pushgateway),然后Prometheus再从pushgateway中获取短周期jobs的度量数据;还可以通过自动发现目标的方式来监控kubernetes集群。所有收集的数据可以存储在本地的TSDB数据库中,并在这些数据上运行规则、检索、聚合和记录新的时间序列,将产生的告警通知推送到Alertmanager组件。通过PromQL来计算指标,再结合Grafana或其他API客户端来可视化数据。Prometheus主要用于大规模的云端环境和容器化微服务(k8s)的监控,通过拉取(pull)应用程序暴露出来的HTTP接口或exporter来获取时间序列数据。Prometheus不适用于对监控要求100%准确的度量数据,比如每个请求的账单,因为收集的数据可能还不够详细和完整。Prometheus将其可以拉取指标的来源称为endpoint(端点),endpoint可以是各种exporter(导出器)或应用程序。然后,为了拉取endpoint里的数据,Prometheus定义了名为target(目标)的配置,告诉拉取时要如何进行连接等信息,多个具有相同功能角色的target组合在一起就构成了一个job(作业),例如,具有相同用途的一组主机的资源监控器(node_exporter),又或者是MySQL数据库监控器(mysqld_exporter)。Prometheus默认是将收集到的时间序列数据存储在本地tsdb数据库中,且默认只保留15天,也可以配置发送到其他时间序列数据库中。
五、安装并配置Prometheus
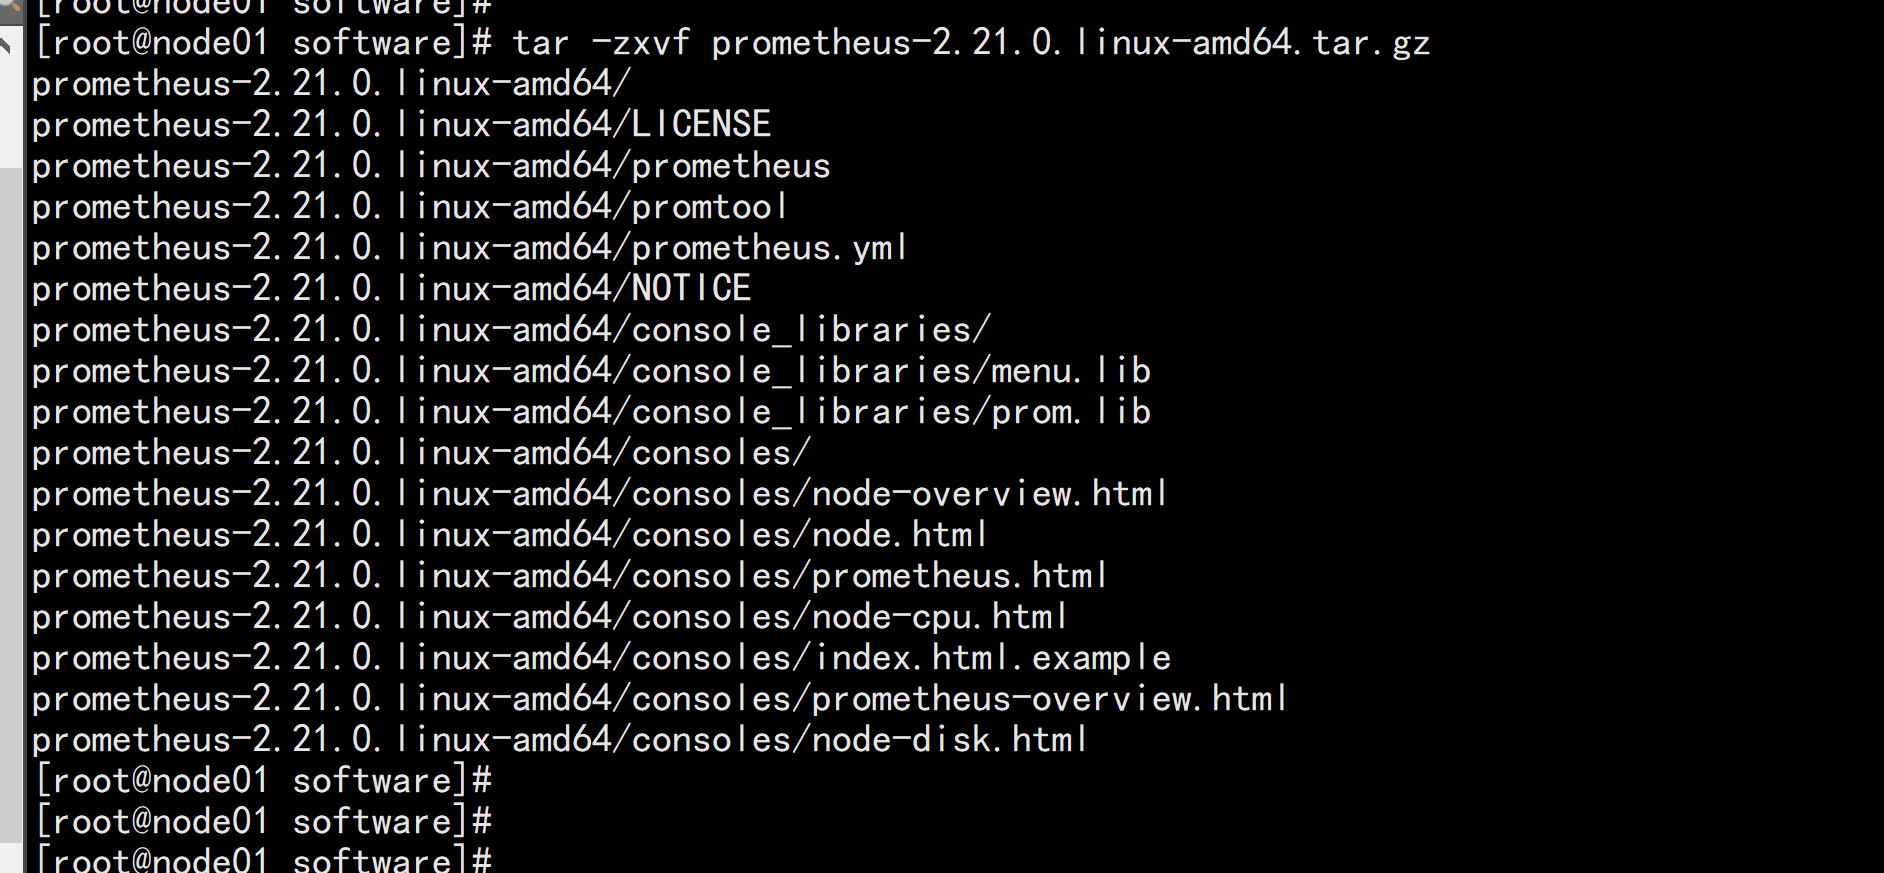
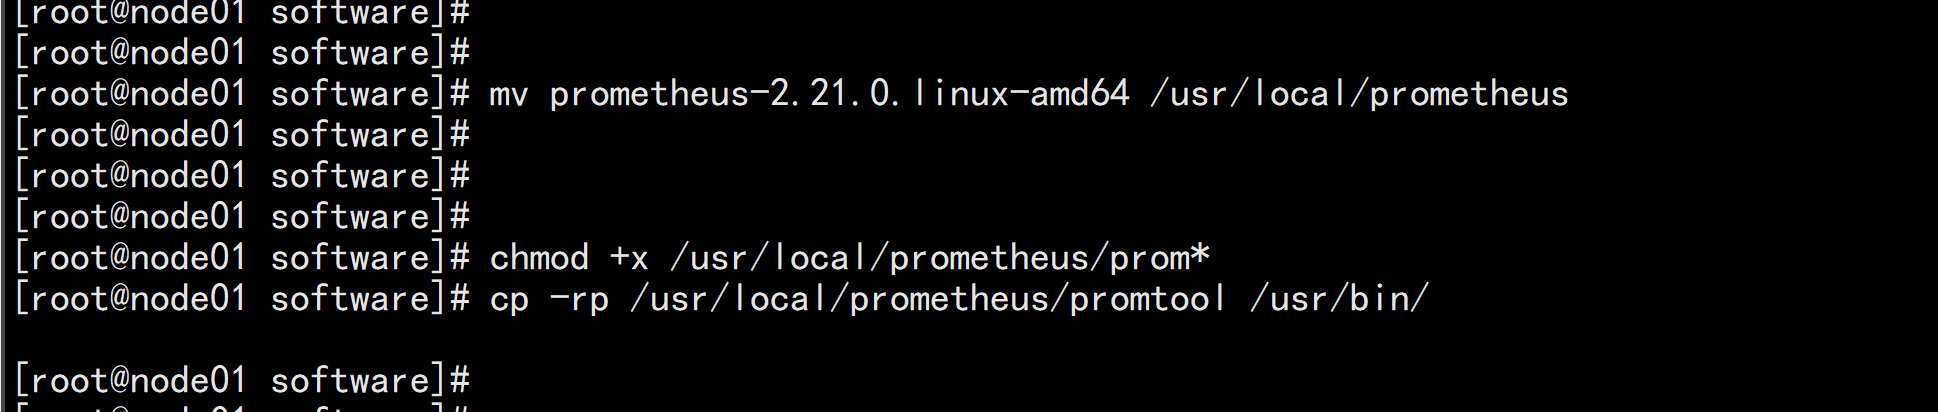
Prometheus本身也是一个导出器(exporter),提供了关于内存使用、垃圾收集以及自身性能与健康状态等各种主机级指标。prometheus官网下载址:https://prometheus.io/download/wget https://github.com/prometheus/prometheus/releases/download/v2.21.0/prometheus-2.21.0.linux-amd64.tar.gz# tar xf prometheus-2.21.0.linux-amd64.tar.gz# mv prometheus-2.21.0.linux-amd64 /usr/local/prometheus# chmod +x /usr/local/prometheus/prom*# cp -rp /usr/local/prometheus/promtool /usr/bin/
Prometheus的配置文件是YAML格式,大致分为四大块,包括:global、alerting、rule_files、scrape_configs。在下面的prometheus.yml配置文件中来描述其用途。
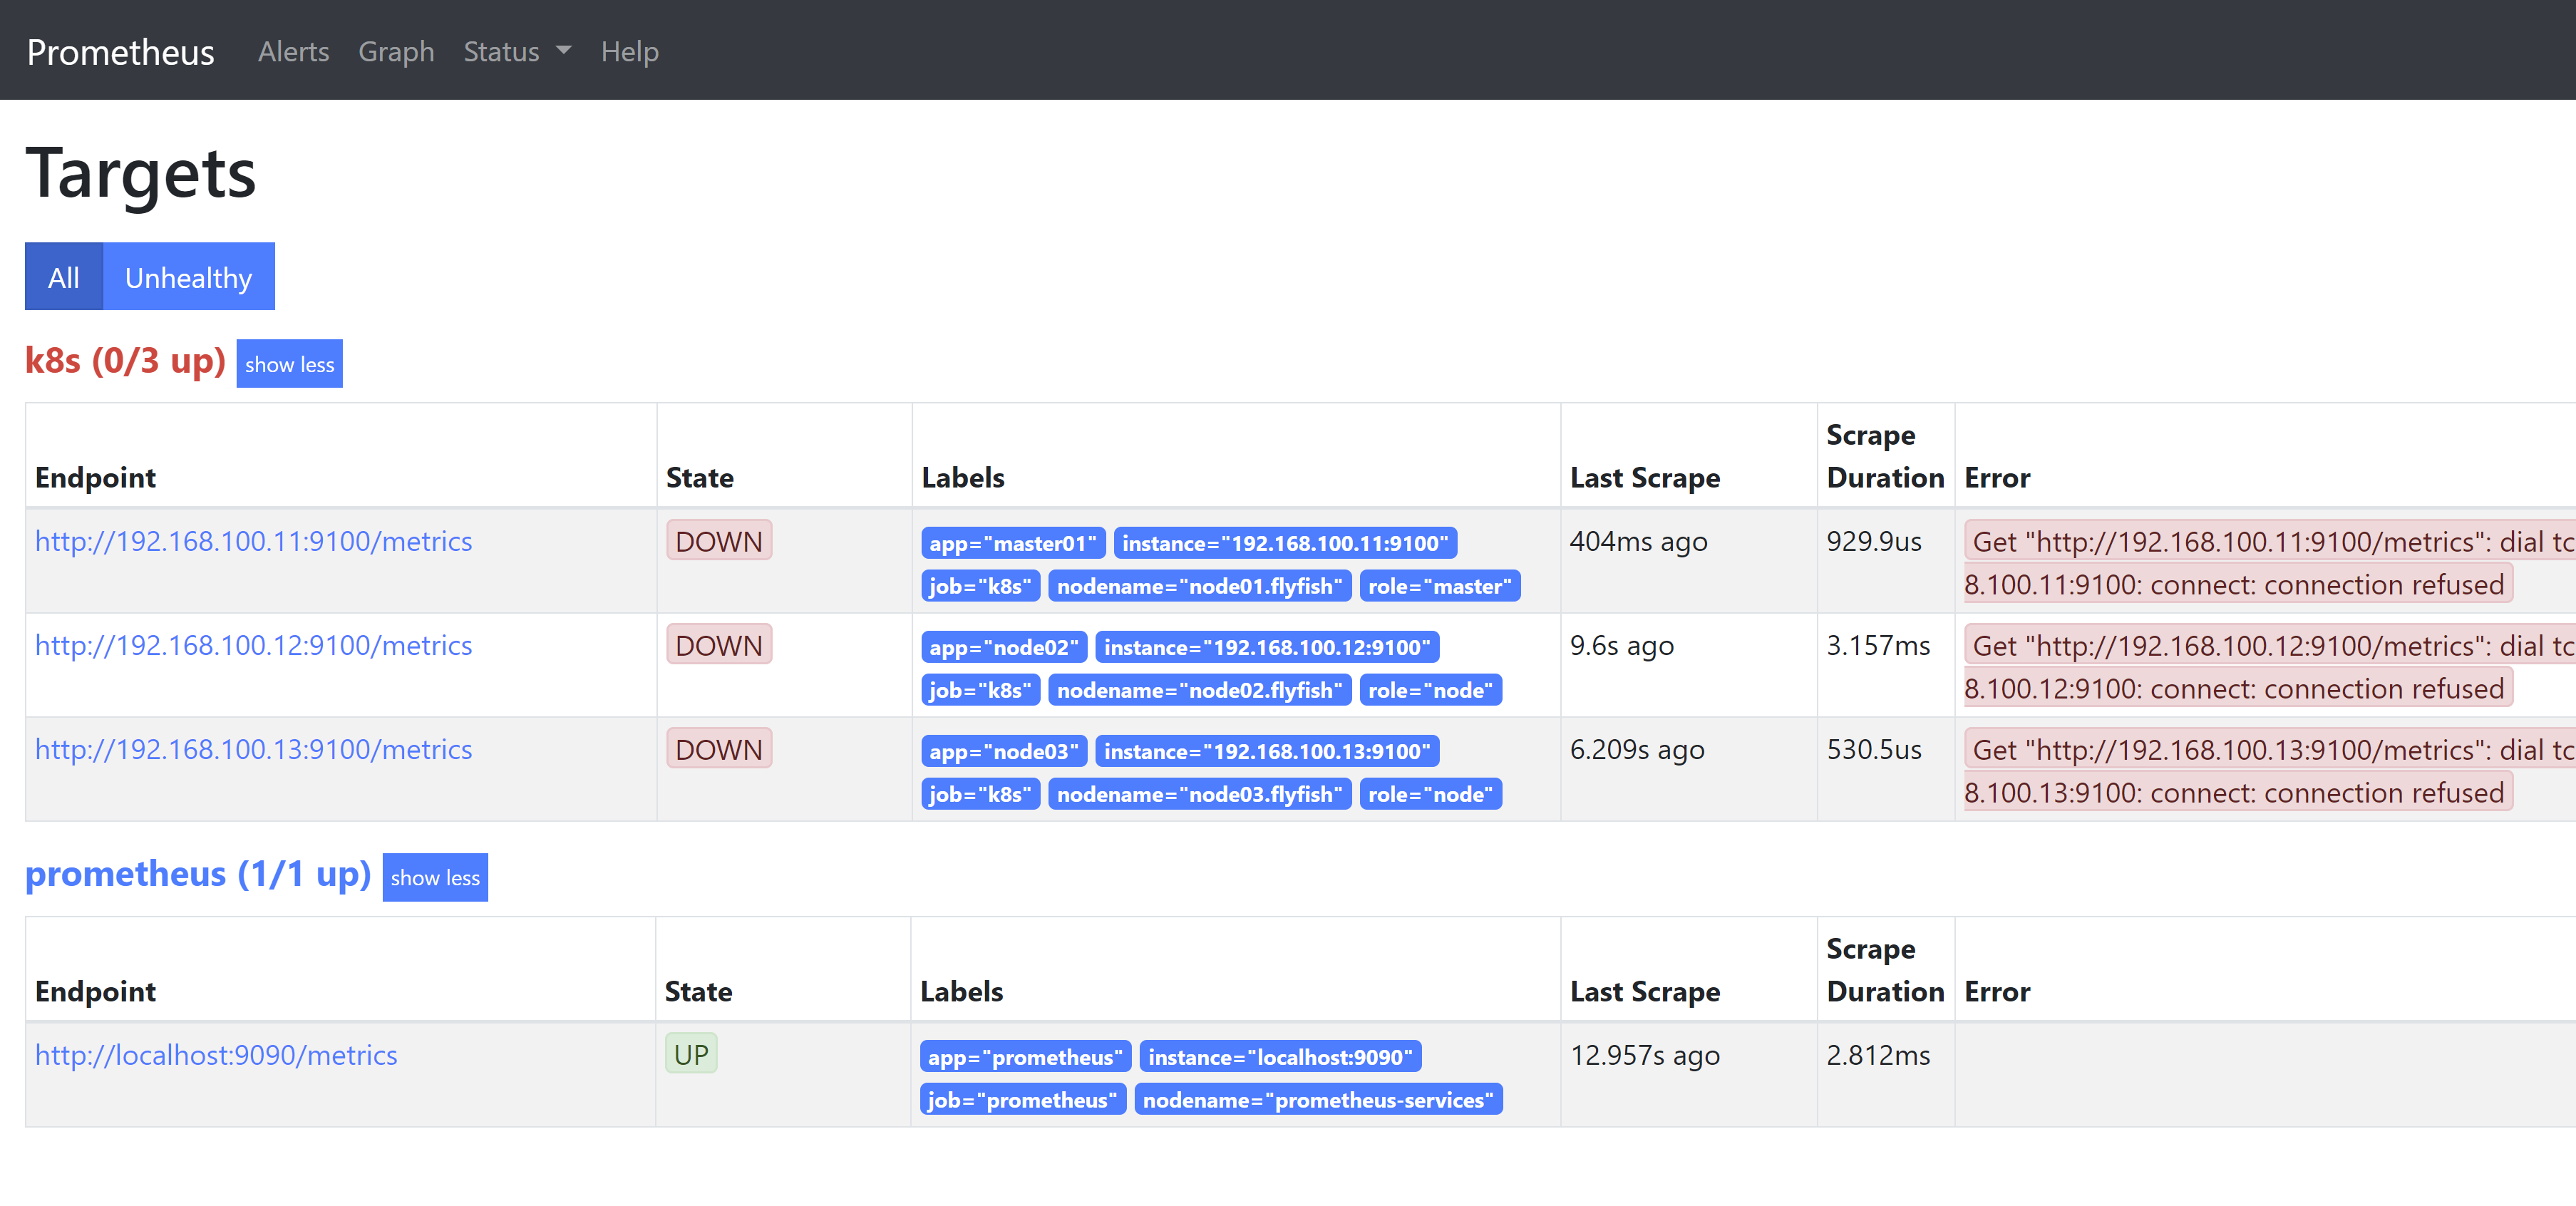
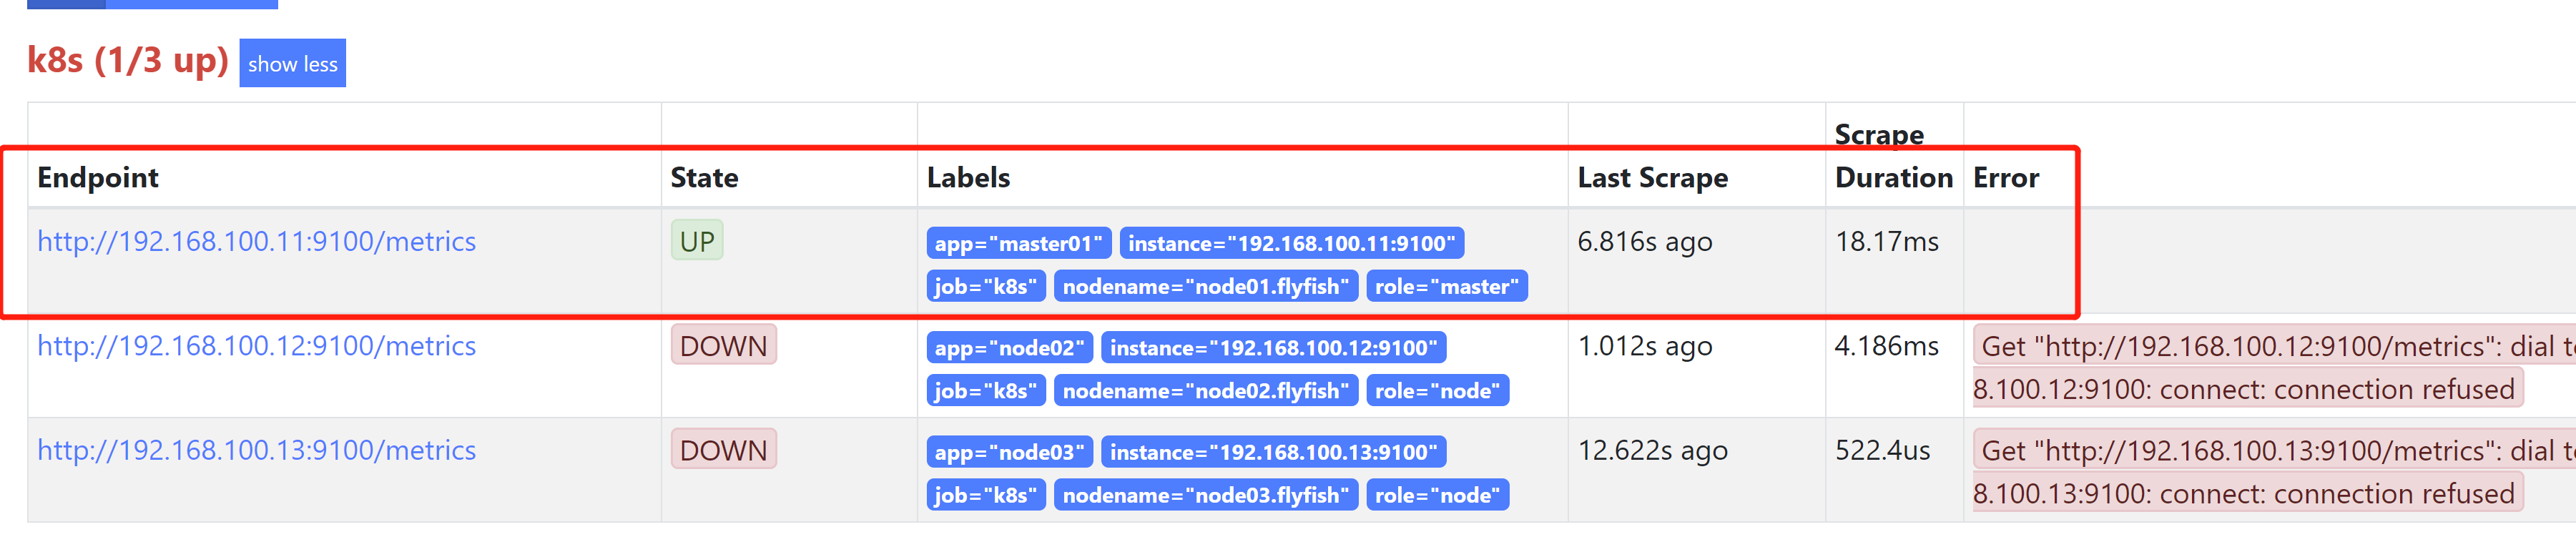
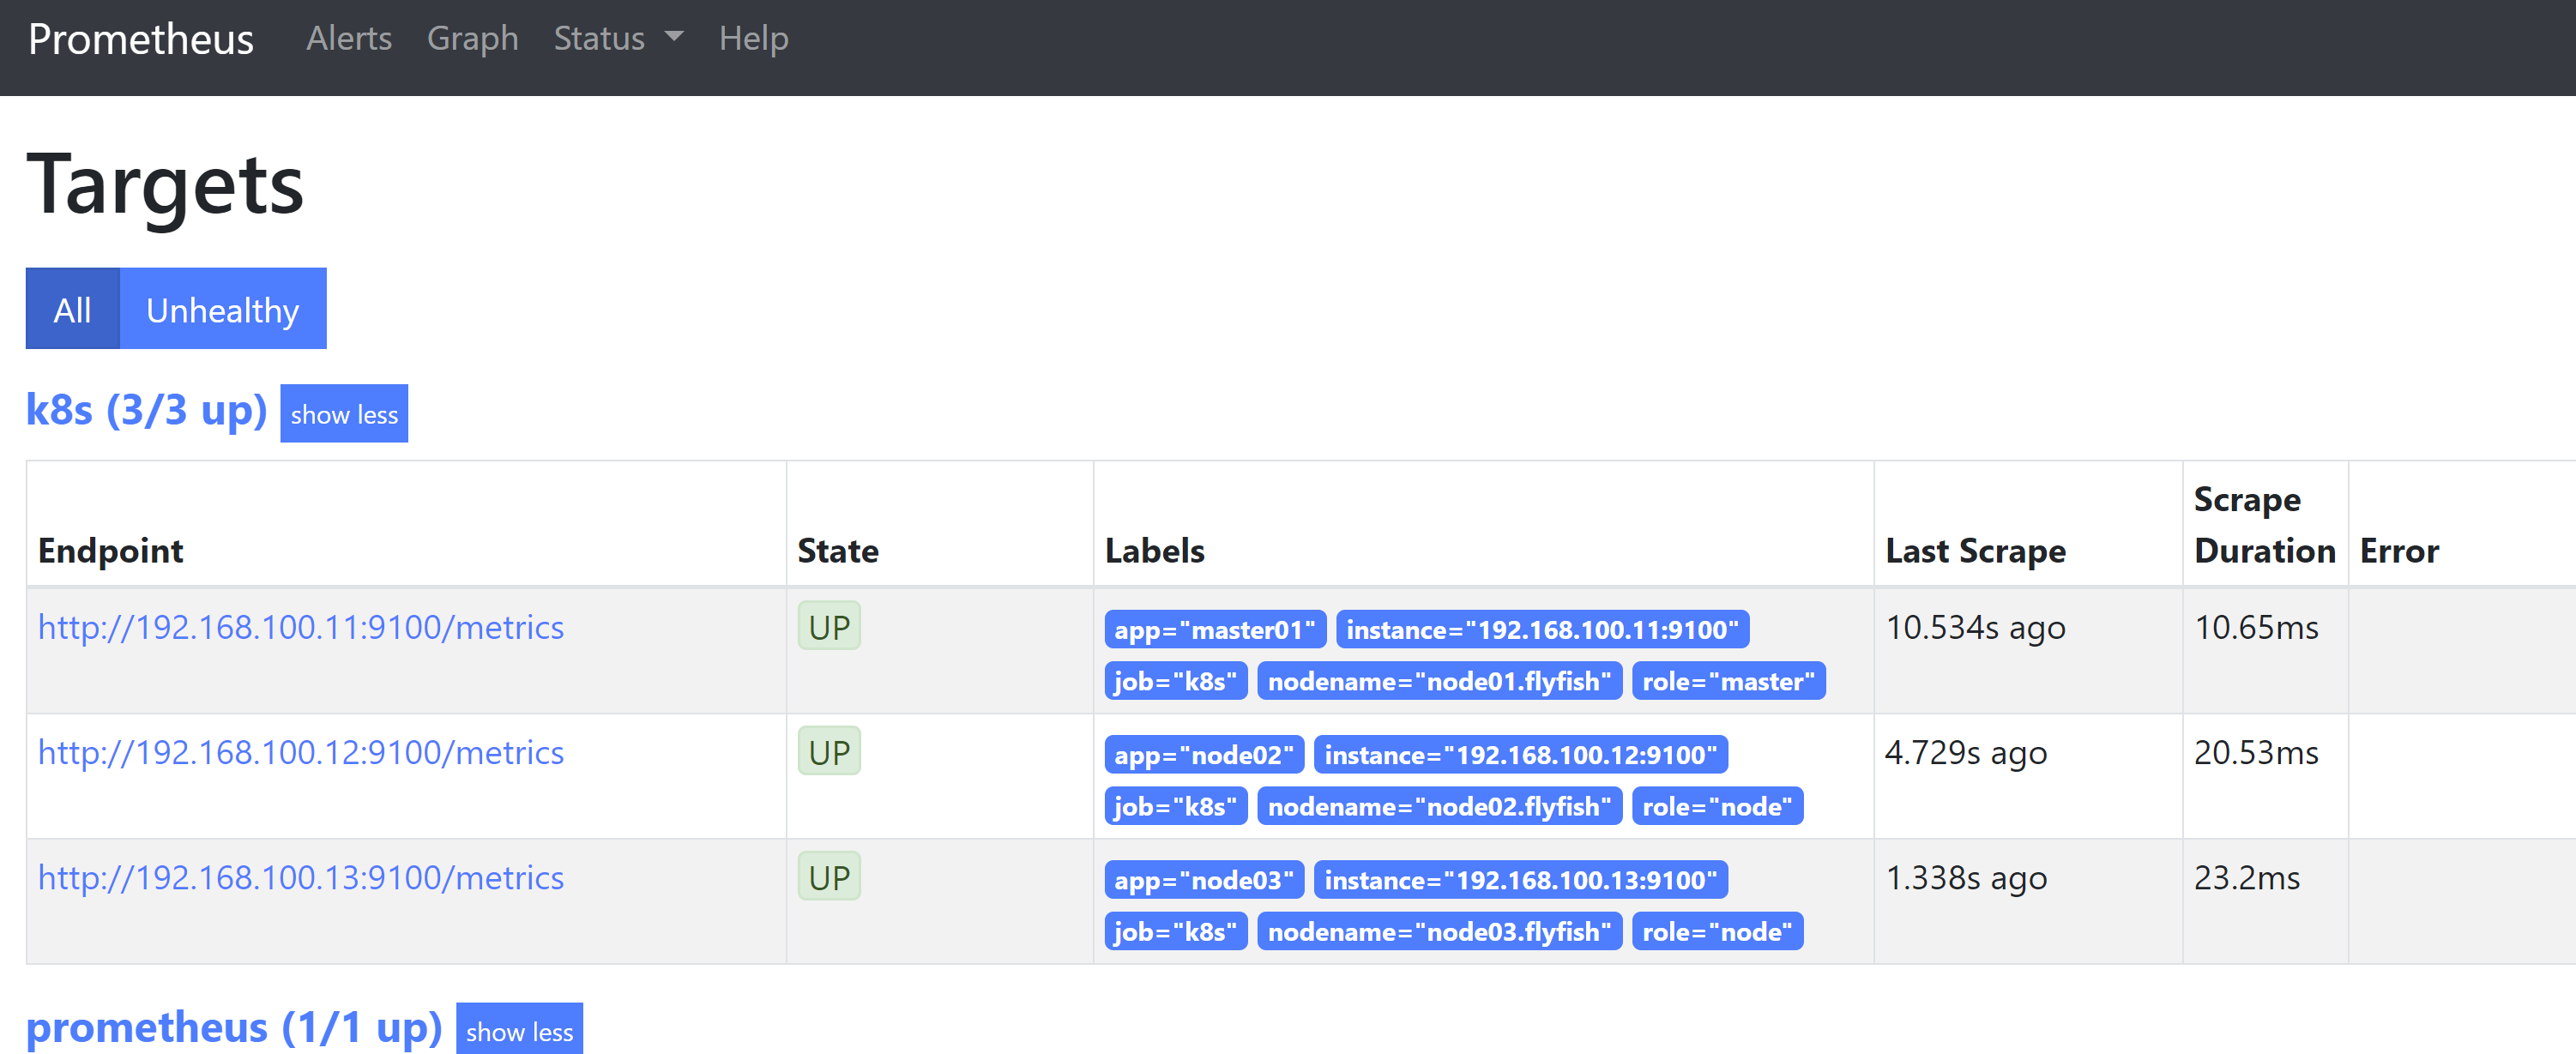
# my global configglobal:scrape_interval: 15s # Set the scrape interval to every 15 seconds. Default is every 1 minute.evaluation_interval: 15s # Evaluate rules every 15 seconds. The default is every 1 minute.# scrape_timeout is set to the global default (10s).# Alertmanager configurationalerting:alertmanagers:- static_configs:- targets:# - alertmanager:9093# Load rules once and periodically evaluate them according to the global 'evaluation_interval'.rule_files:# - "first_rules.yml"# - "second_rules.yml"# A scrape configuration containing exactly one endpoint to scrape:# Here it's Prometheus itself.scrape_configs:# The job name is added as a label `job=<job_name>` to any timeseries scraped from this config.- job_name: 'prometheus'# metrics_path defaults to '/metrics'# scheme defaults to 'http'.static_configs:- targets: ['localhost:9090']labels:app: prometheusnodename: prometheus-services- job_name: 'k8s'static_configs:- targets: ['192.168.100.11:9100']labels:app: master01nodename: node01.flyfishrole: master- targets: ['192.168.100.12:9100']labels:app: node02nodename: node02.flyfishrole: node- targets: ['192.168.100.13:9100']labels:app: node03nodename: node03.flyfishrole: node
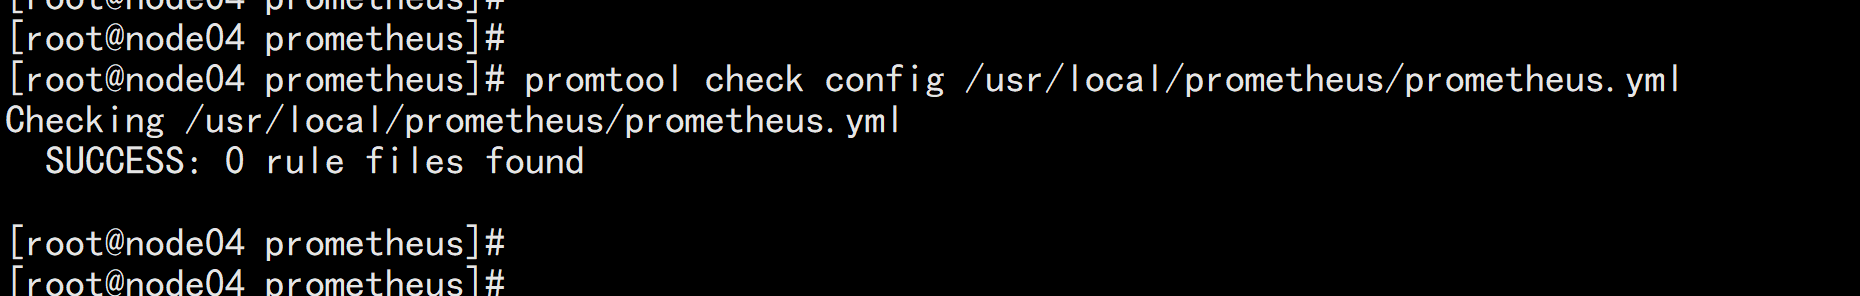
promtool check config /usr/local/prometheus/prometheus.yml
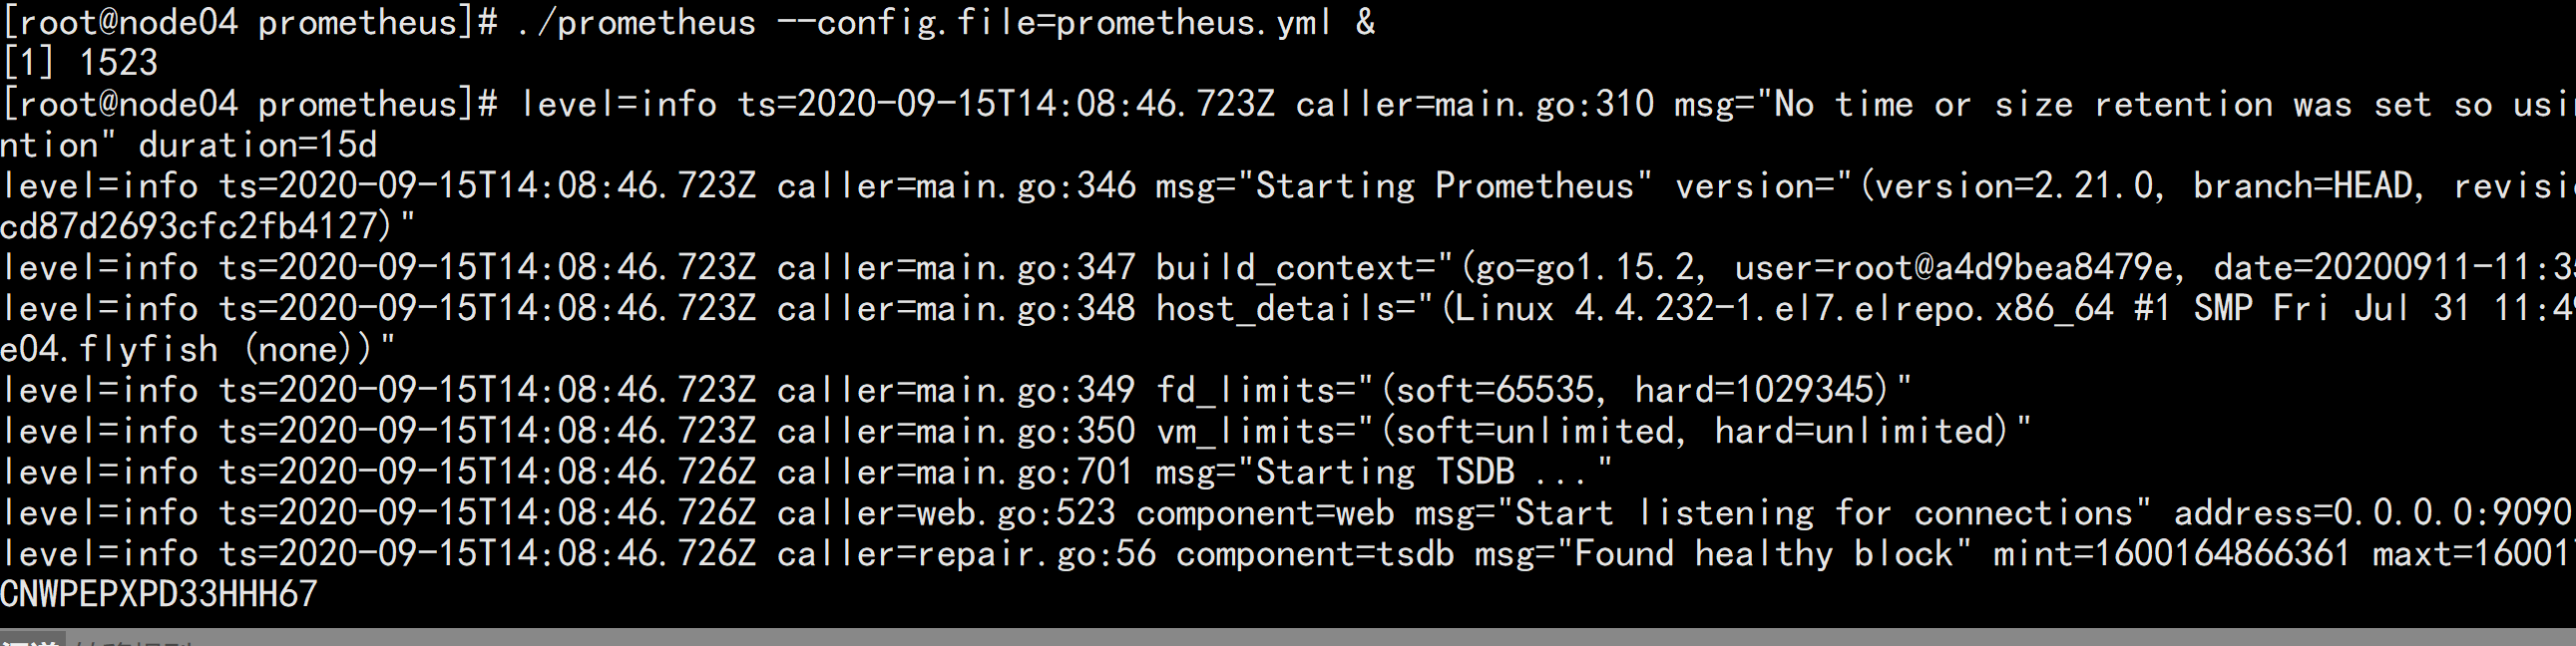
启动prometheus:cd /usr/local/prometheus/./prometheus --config.file=prometheus.yml &
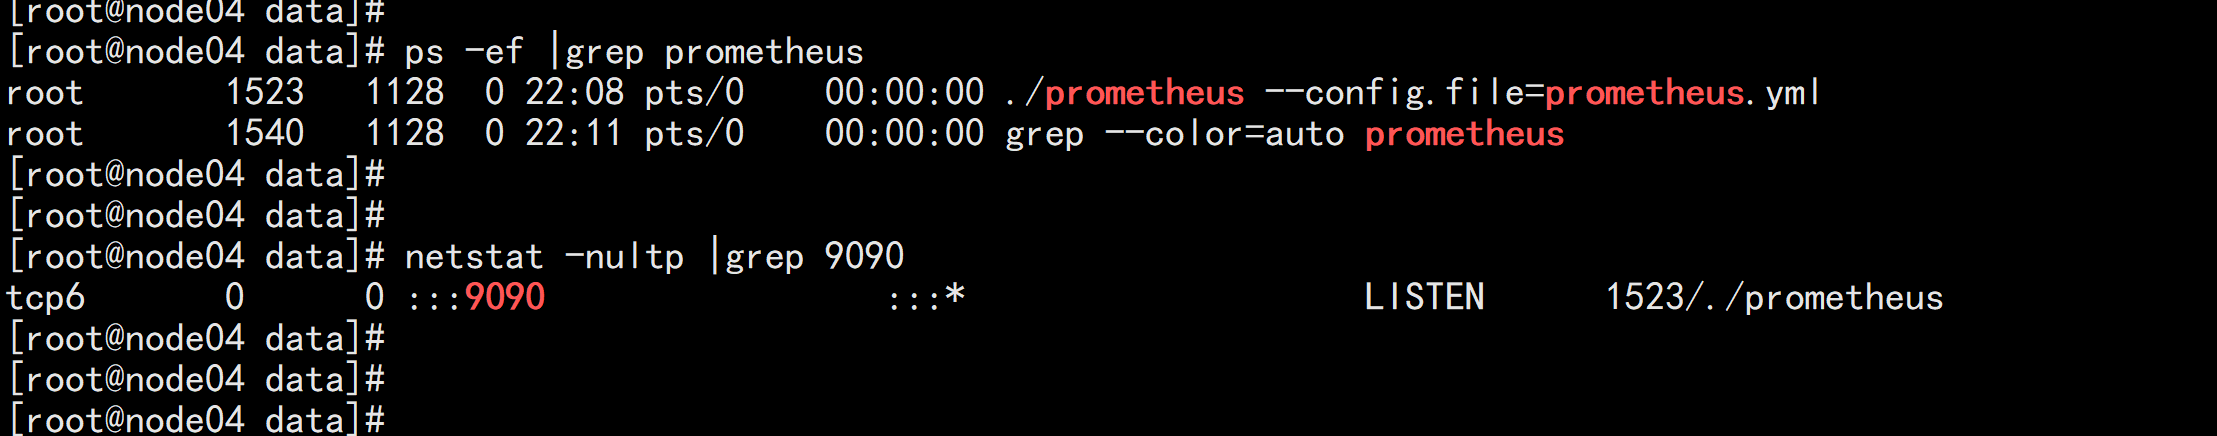
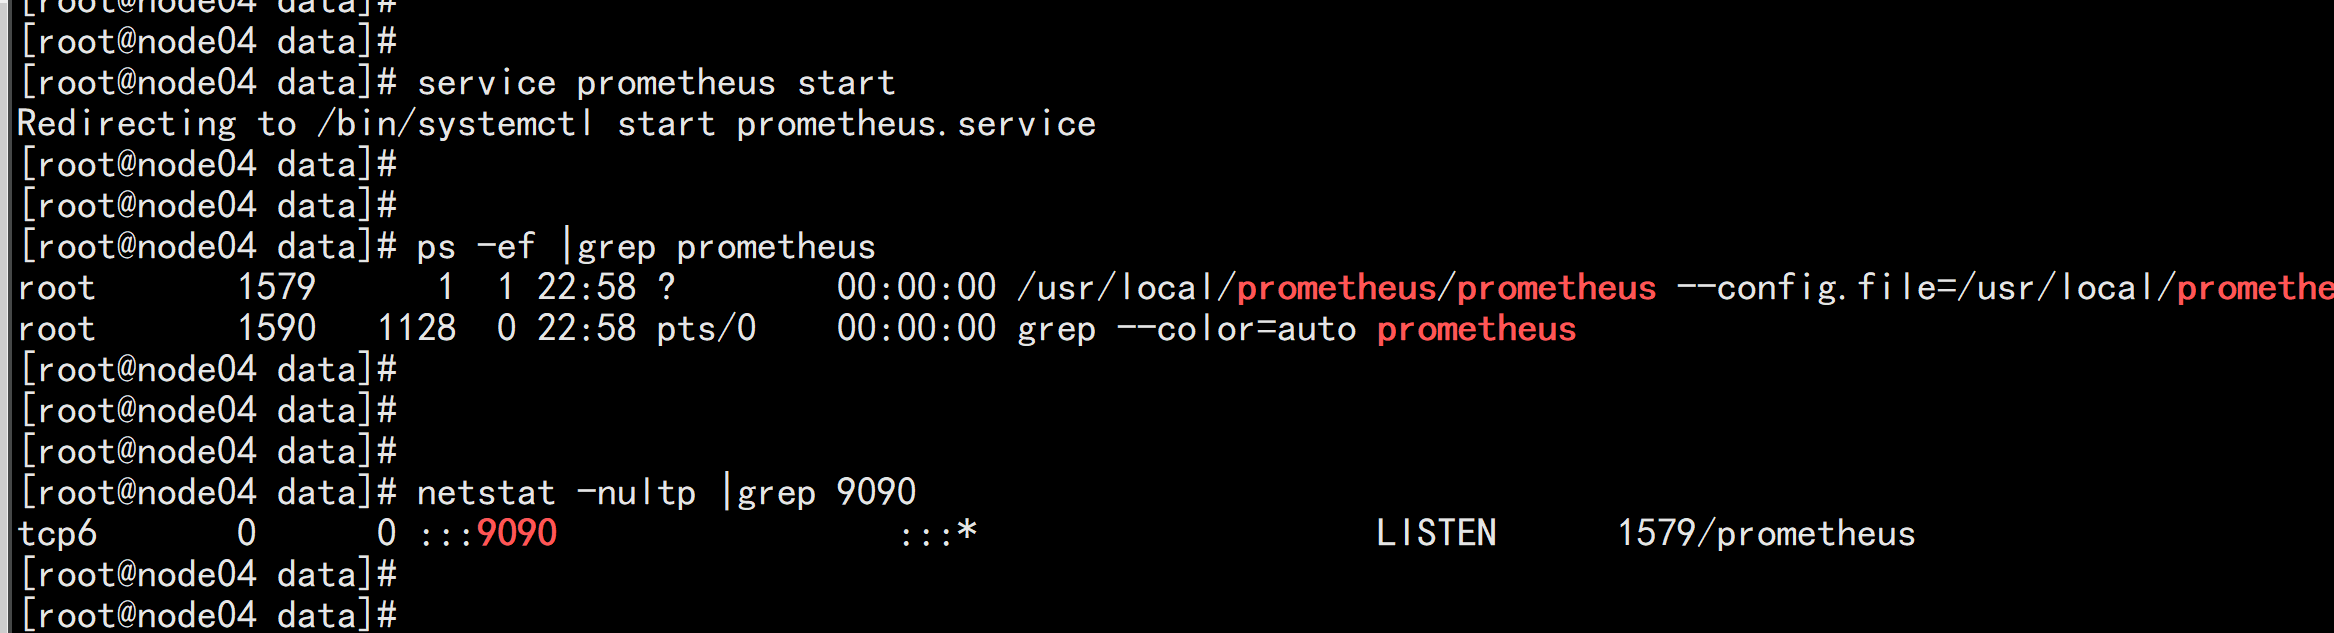
ps -ef |grep prometheusnetstat -nultp |grep 9090
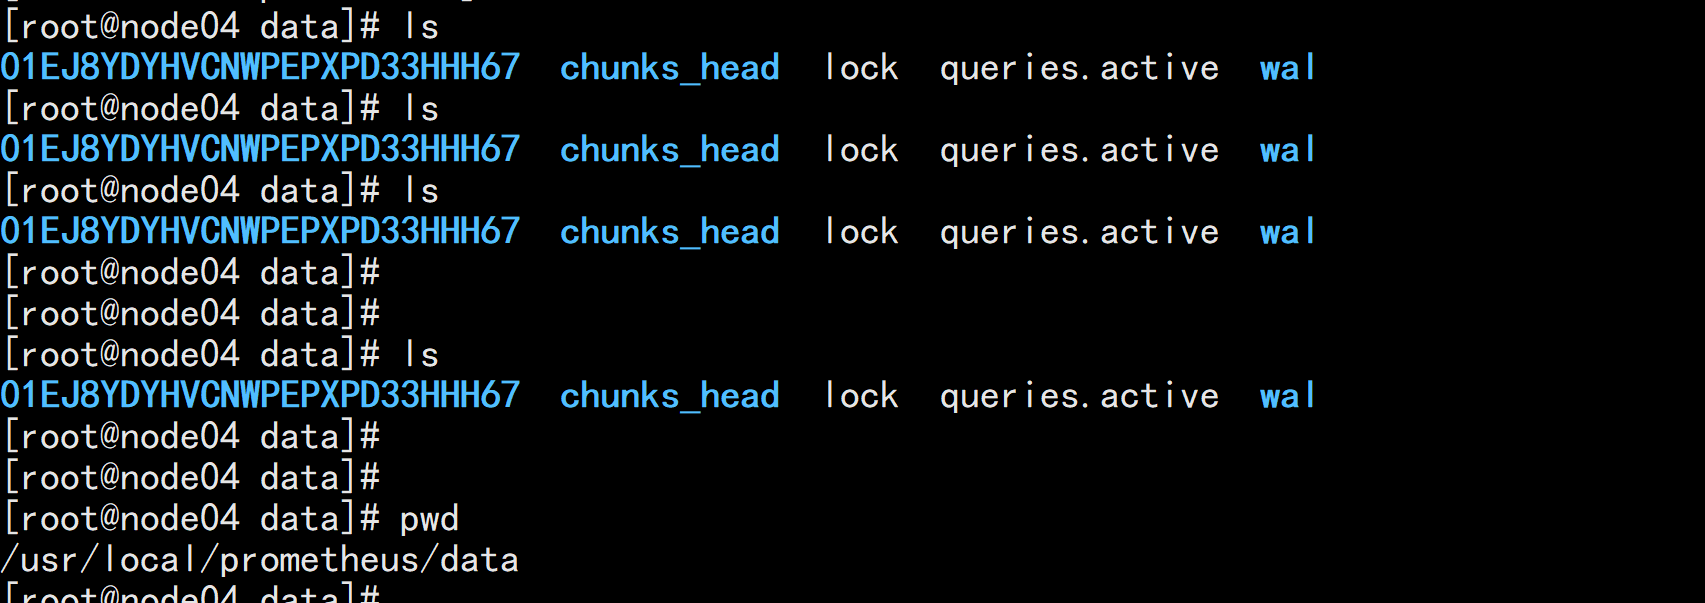
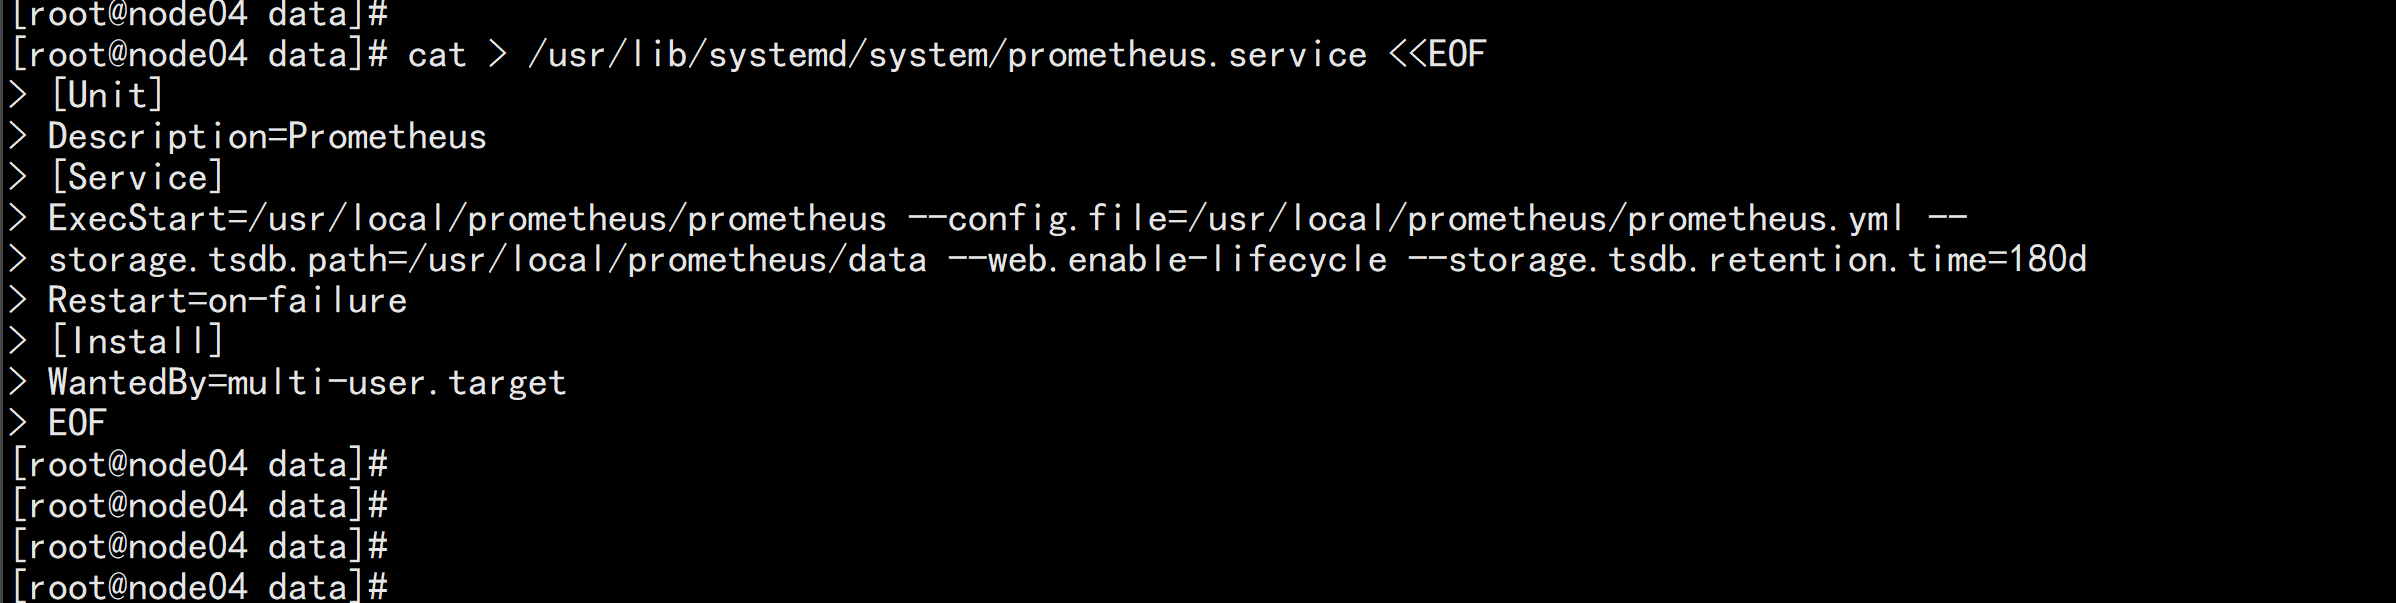
守护进程启动cat > /usr/lib/systemd/system/prometheus.service <<EOF[Unit]Description=Prometheus[Service]ExecStart=/usr/local/prometheus/prometheus --config.file=/usr/local/prometheus/prometheus.yml --storage.tsdb.path=/usr/local/prometheus/data --web.enable-lifecycle --storage.tsdb.retention.time=180dRestart=on-failure[Install]WantedBy=multi-user.targetEOF
chmod +x /usr/lib/systemd/system/prometheus.serviceservice prometheus startchkconfig prometheus on
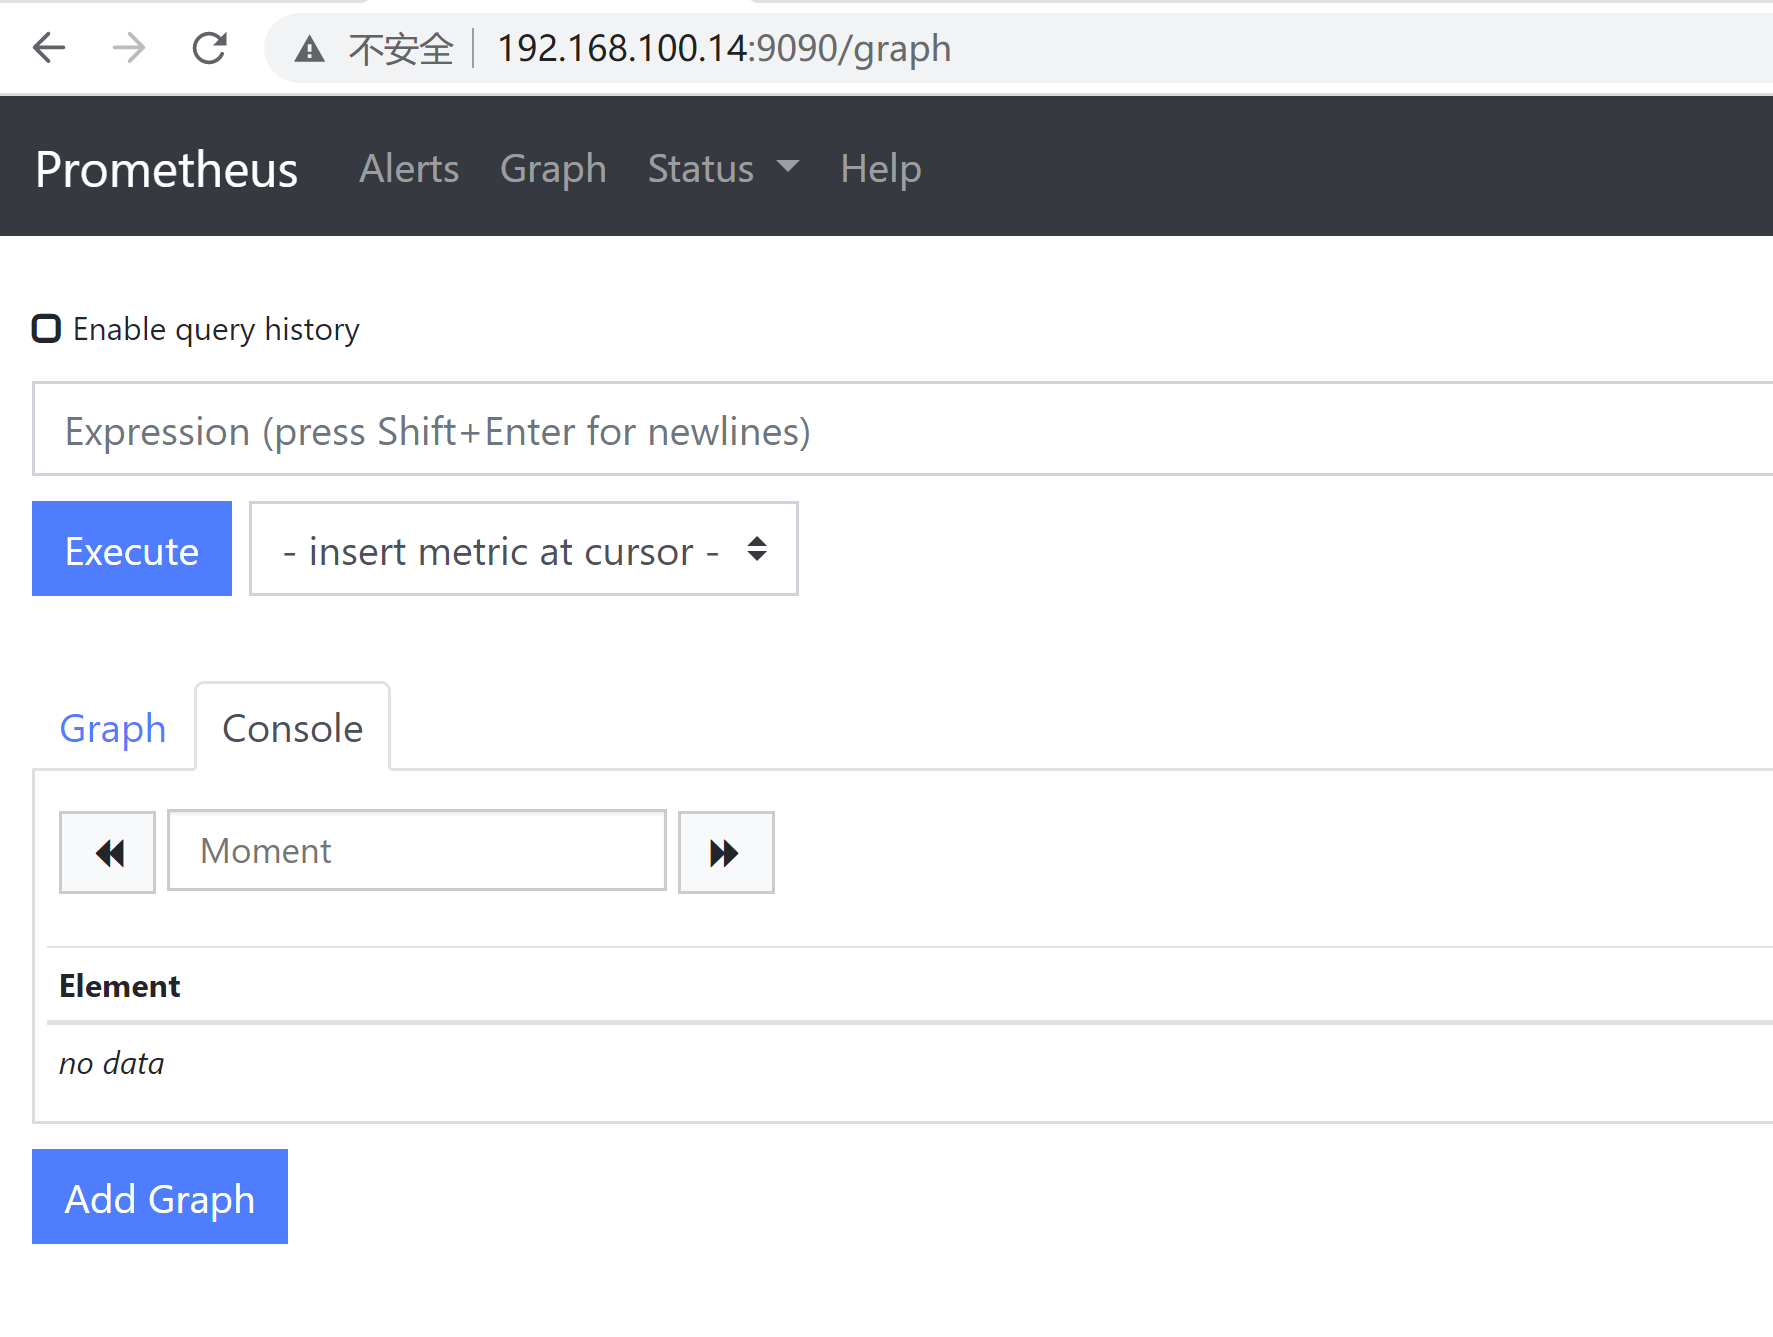
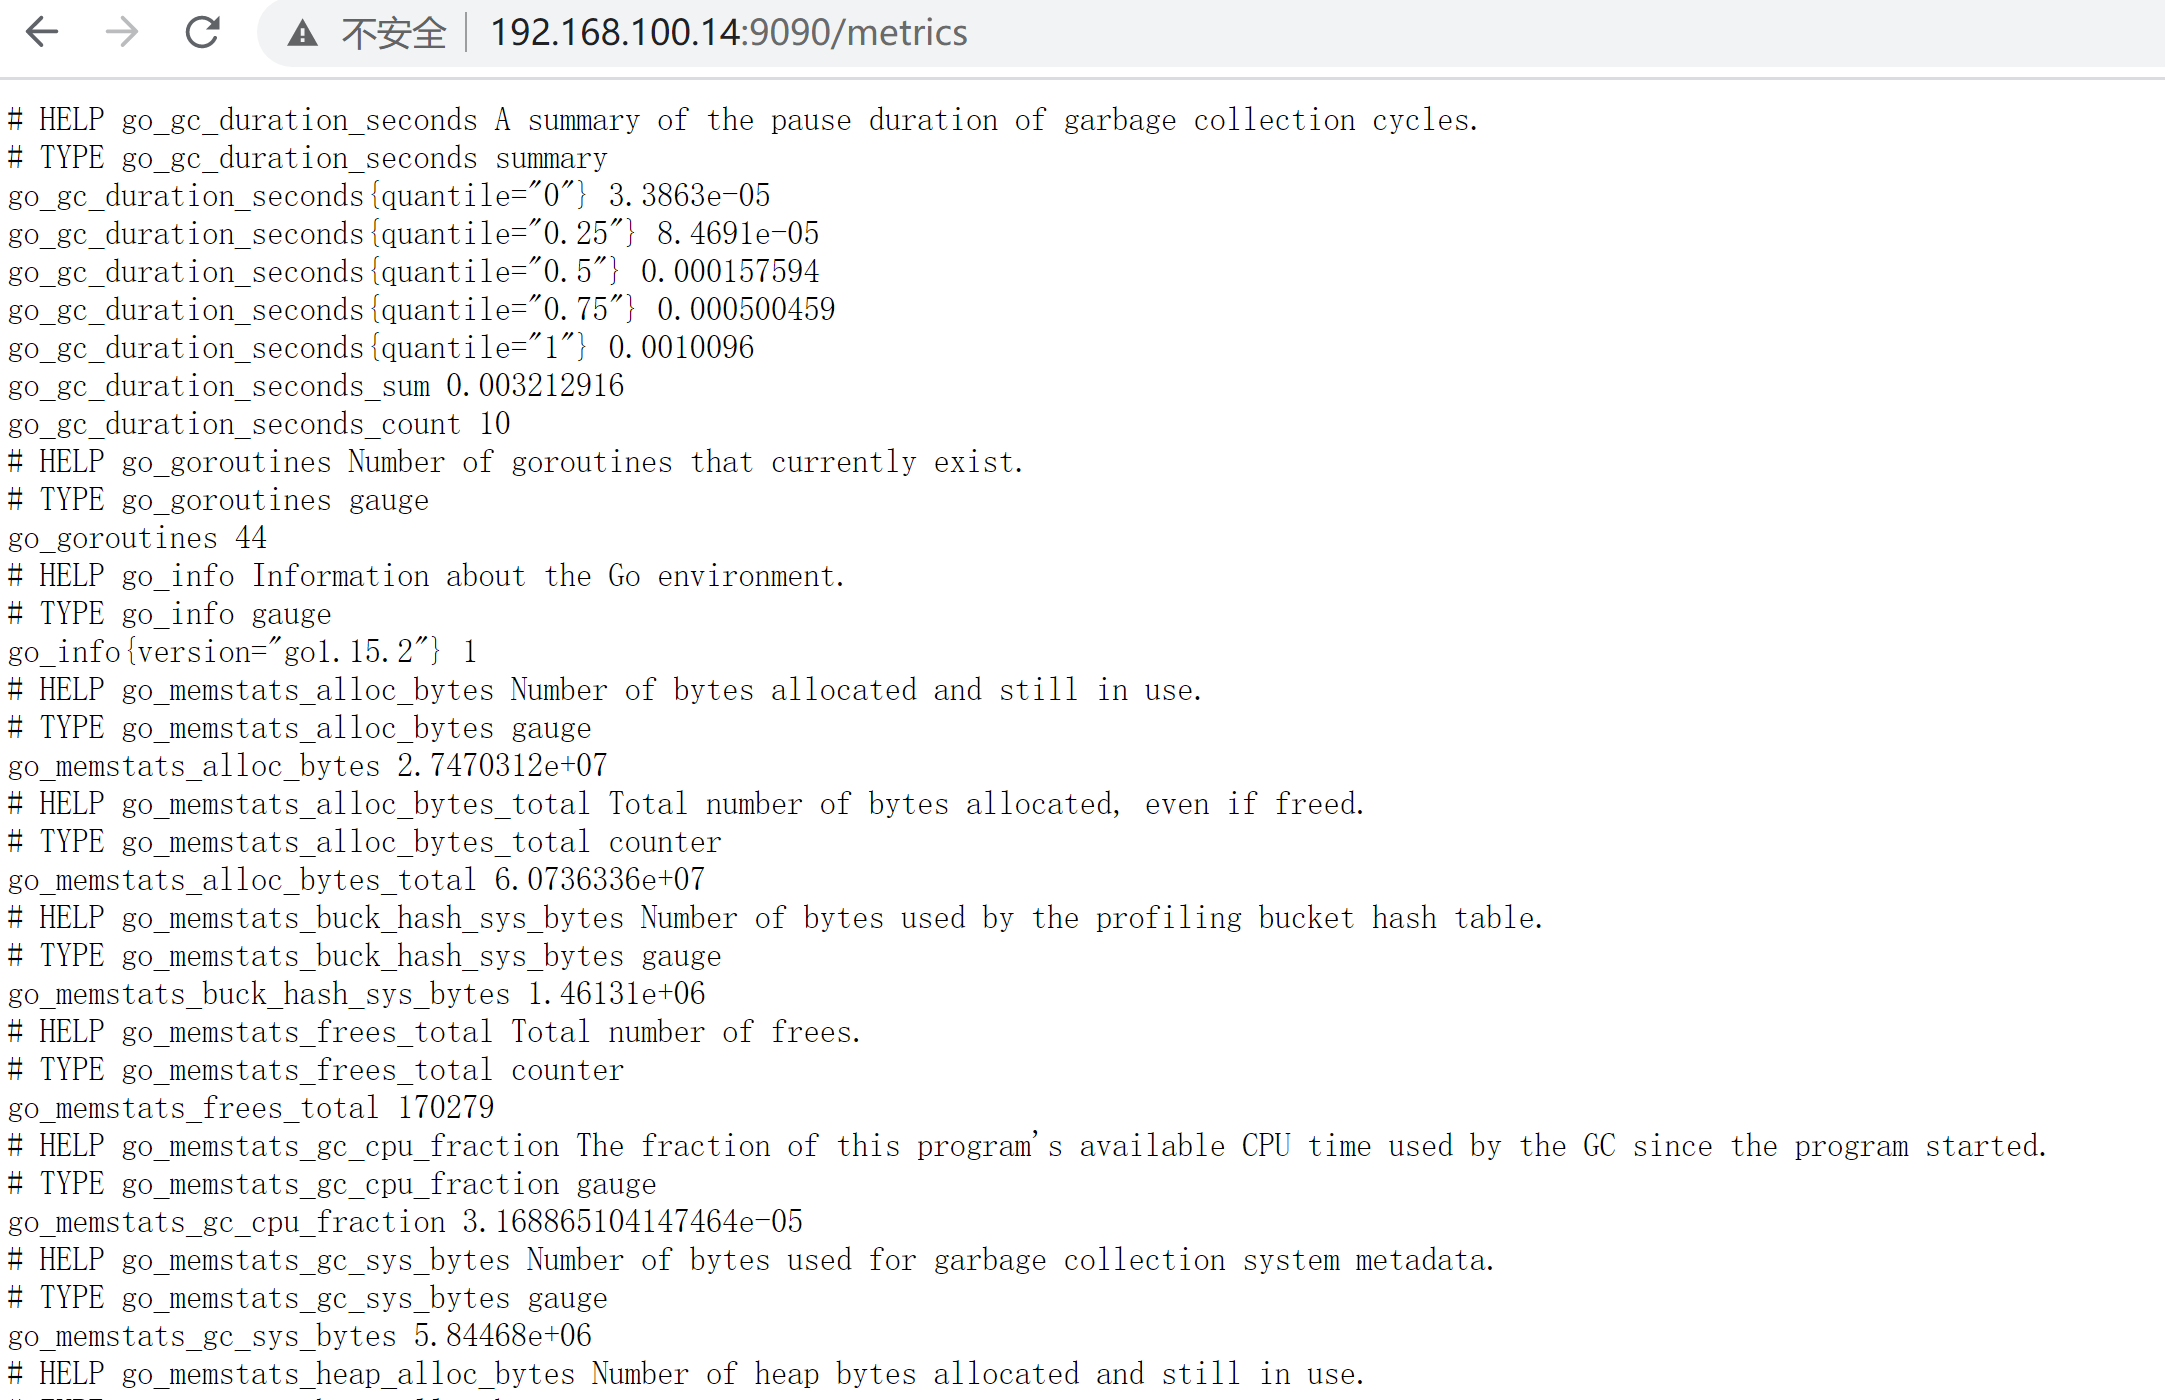
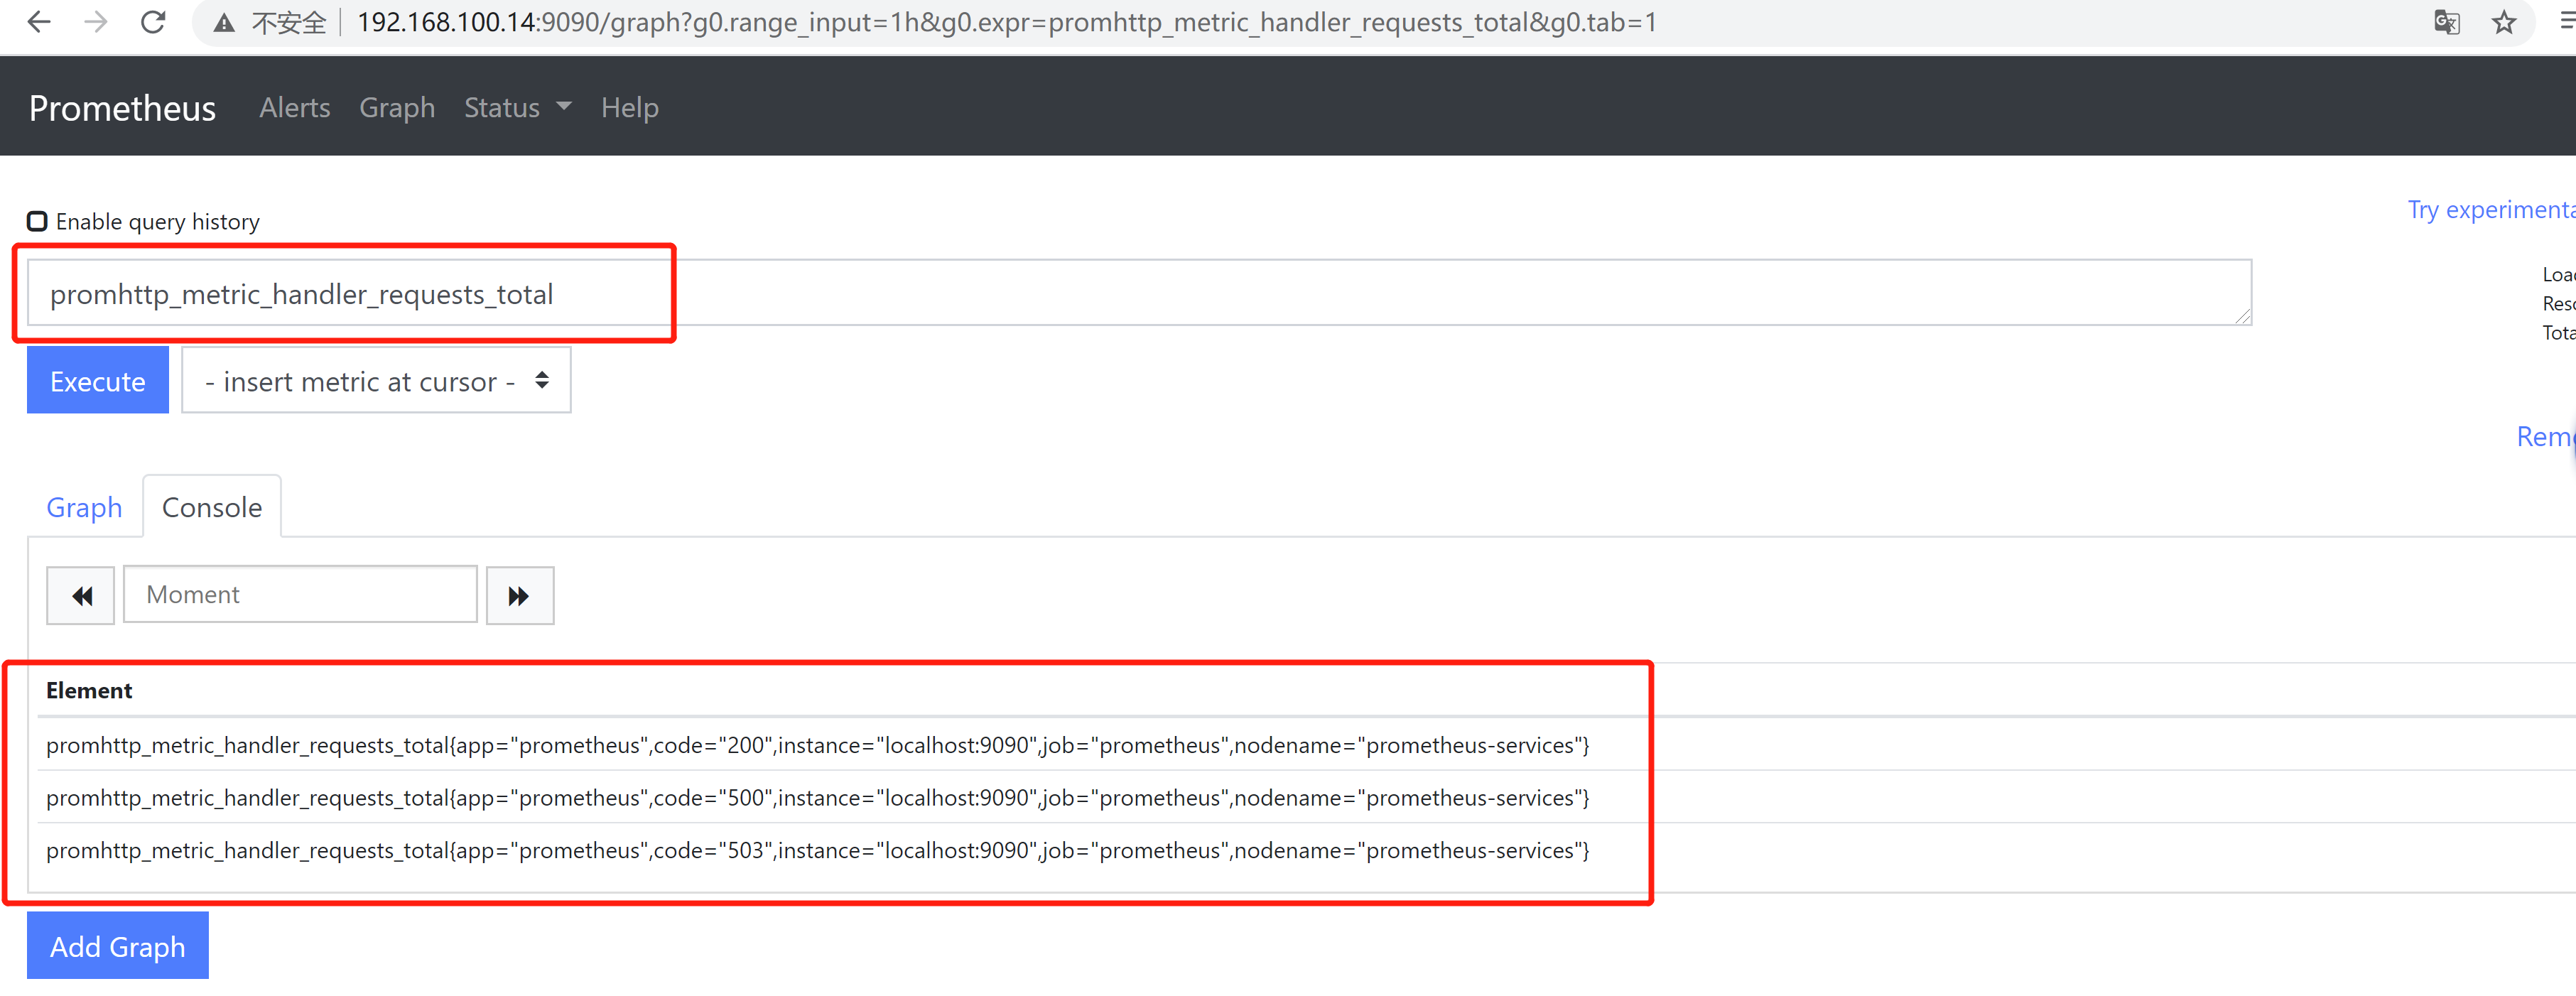
打开webPrometheus内置的控制台访问入口:http://IP:9090/graphPrometheus本身暴露度量数据的HTTP接口为:http://IP:9090/metrics
promhttp_metric_handler_requests_total
promhttp_metric_handler_requests_total{code="200"}

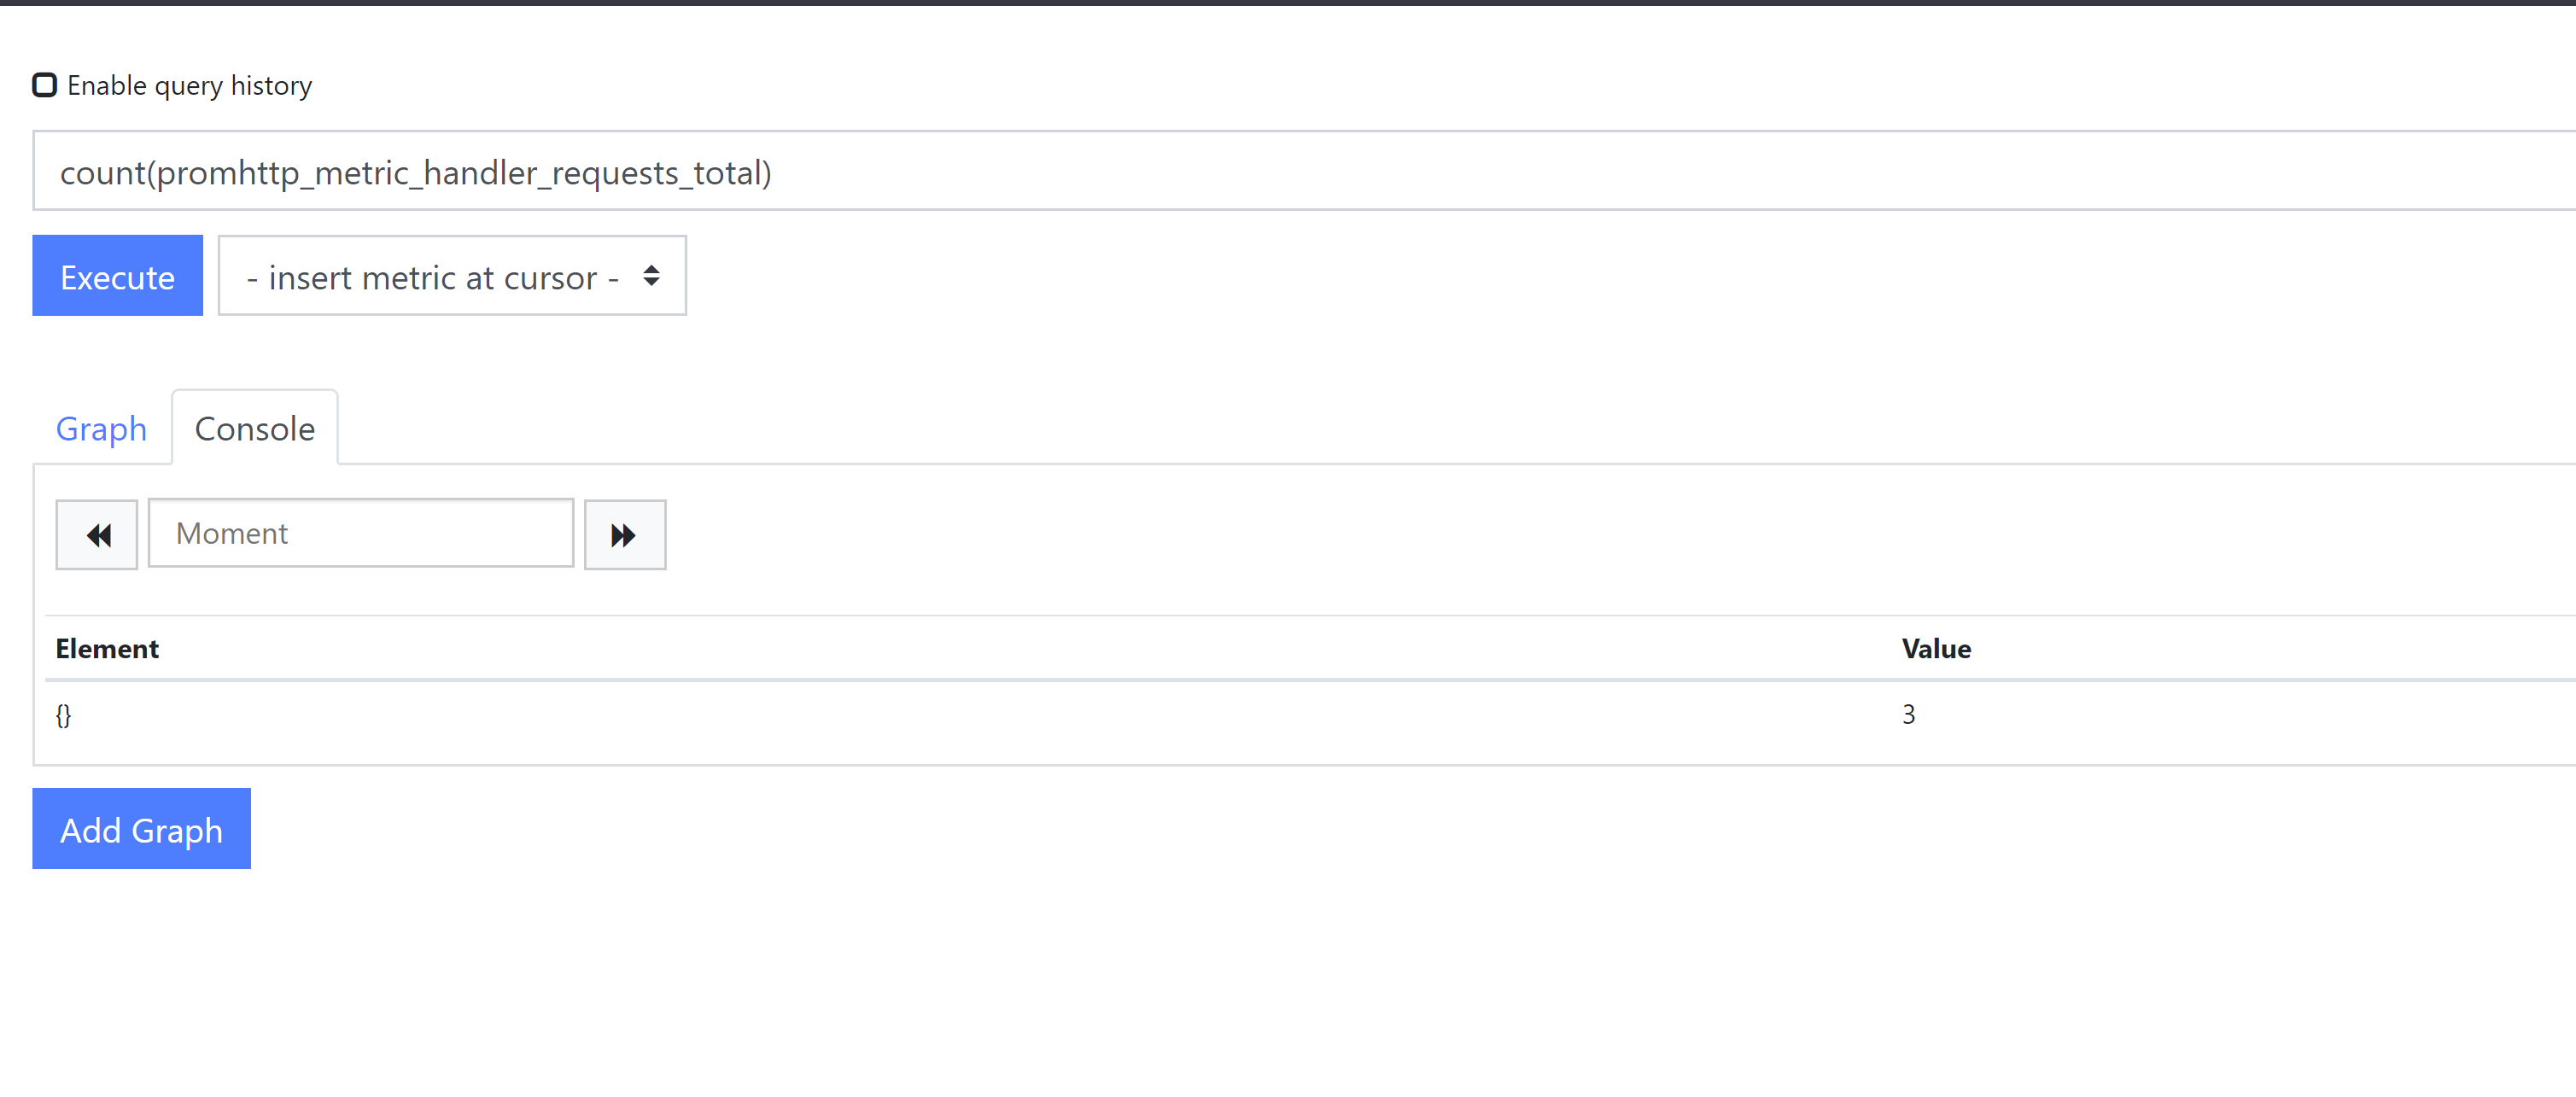
count(promhttp_metric_handler_requests_total)
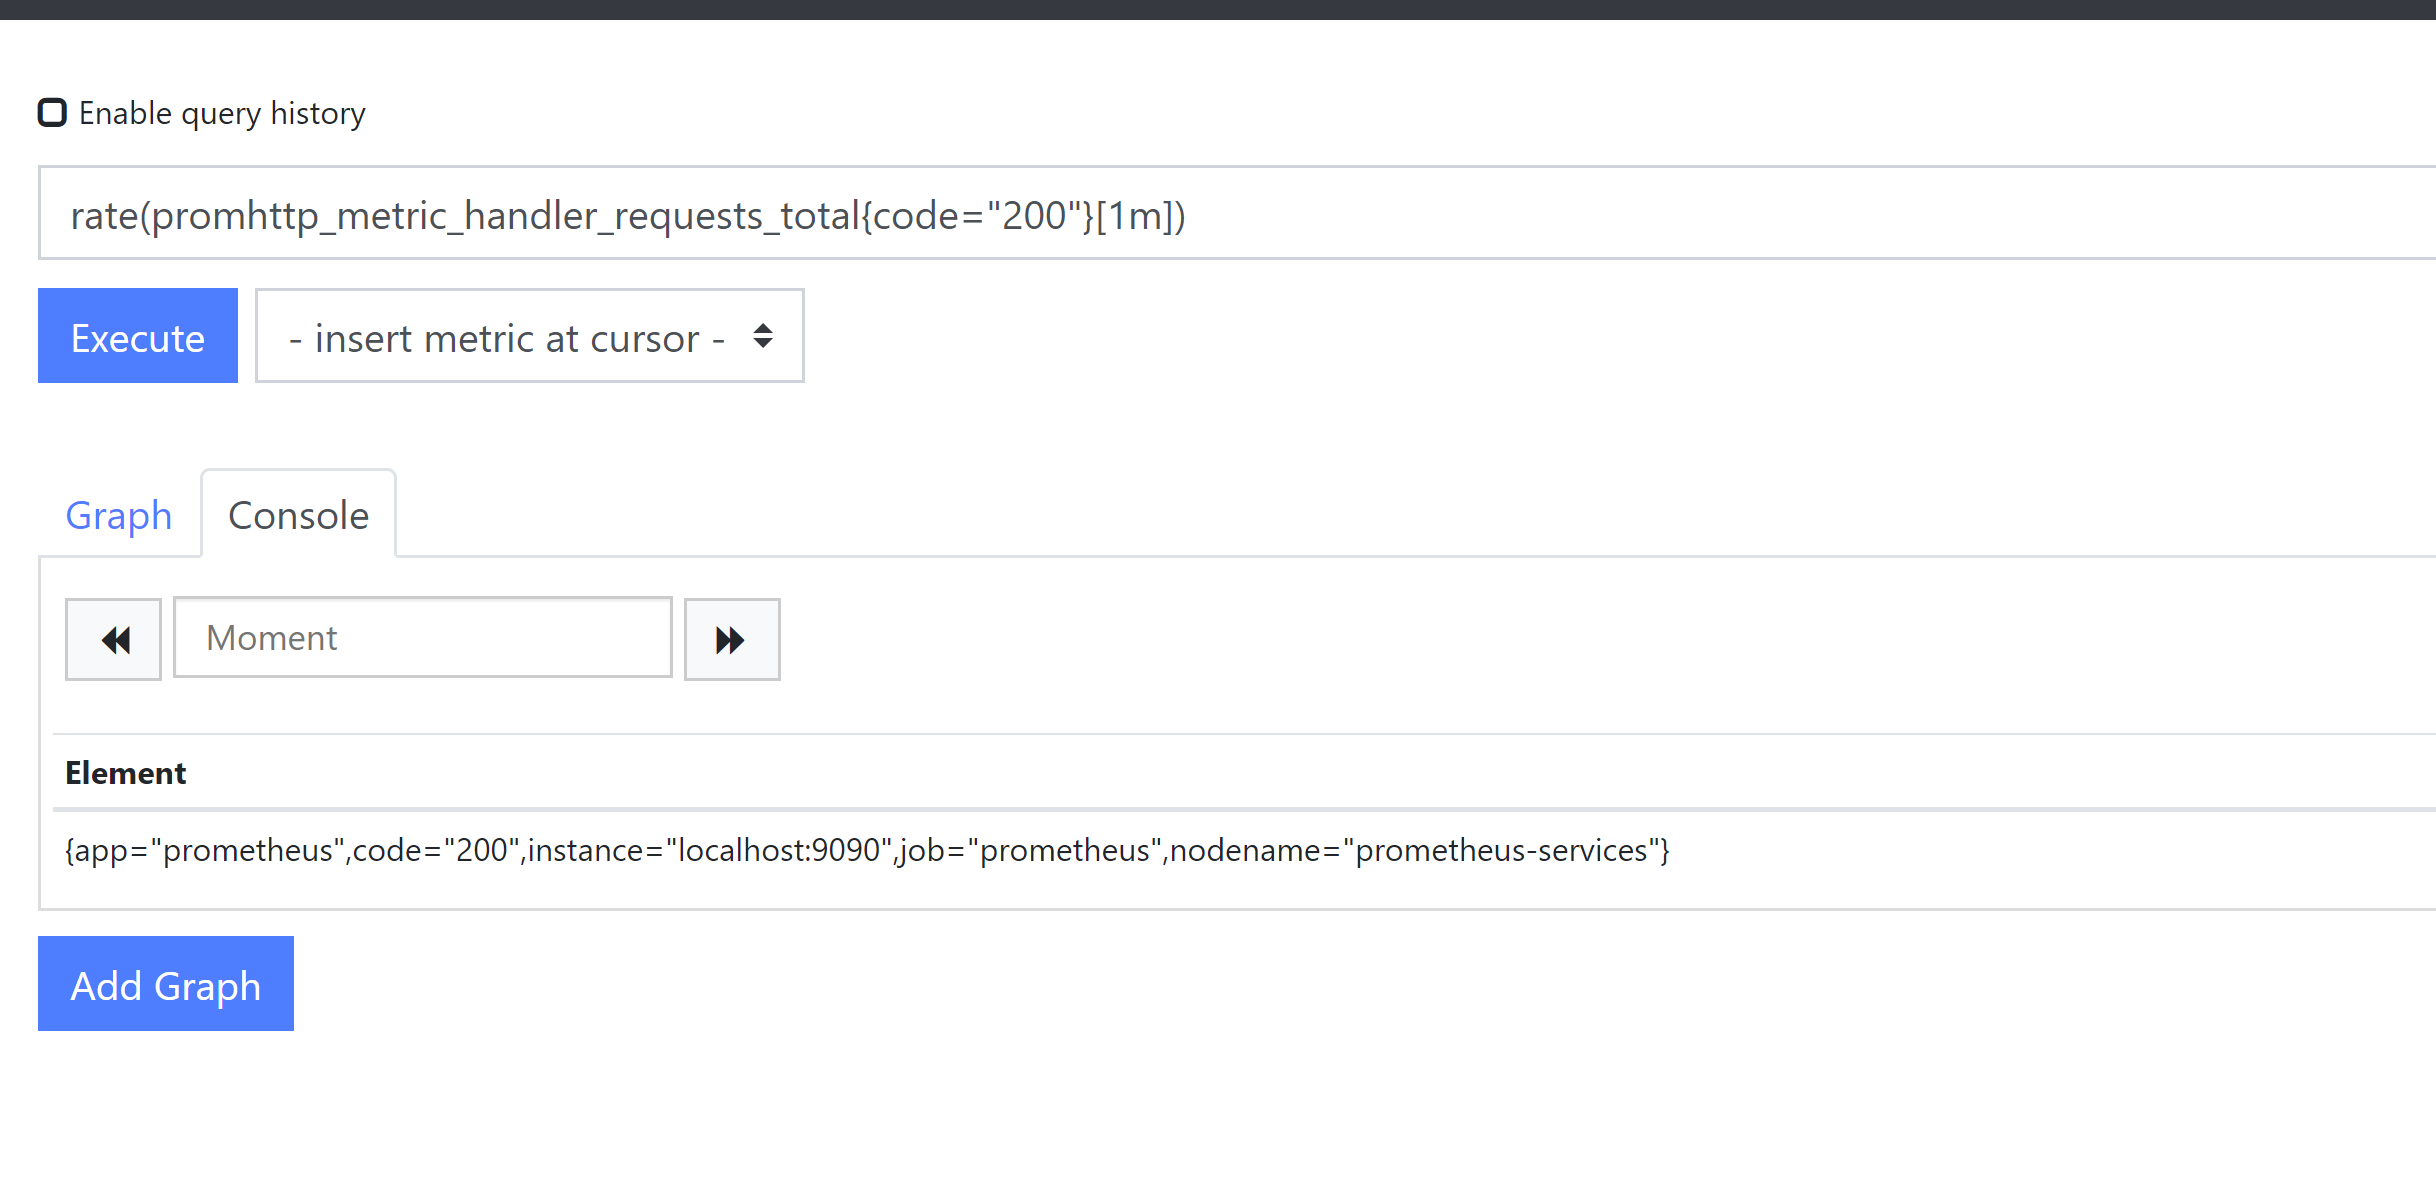
rate(promhttp_metric_handler_requests_total{code="200"}[1m])
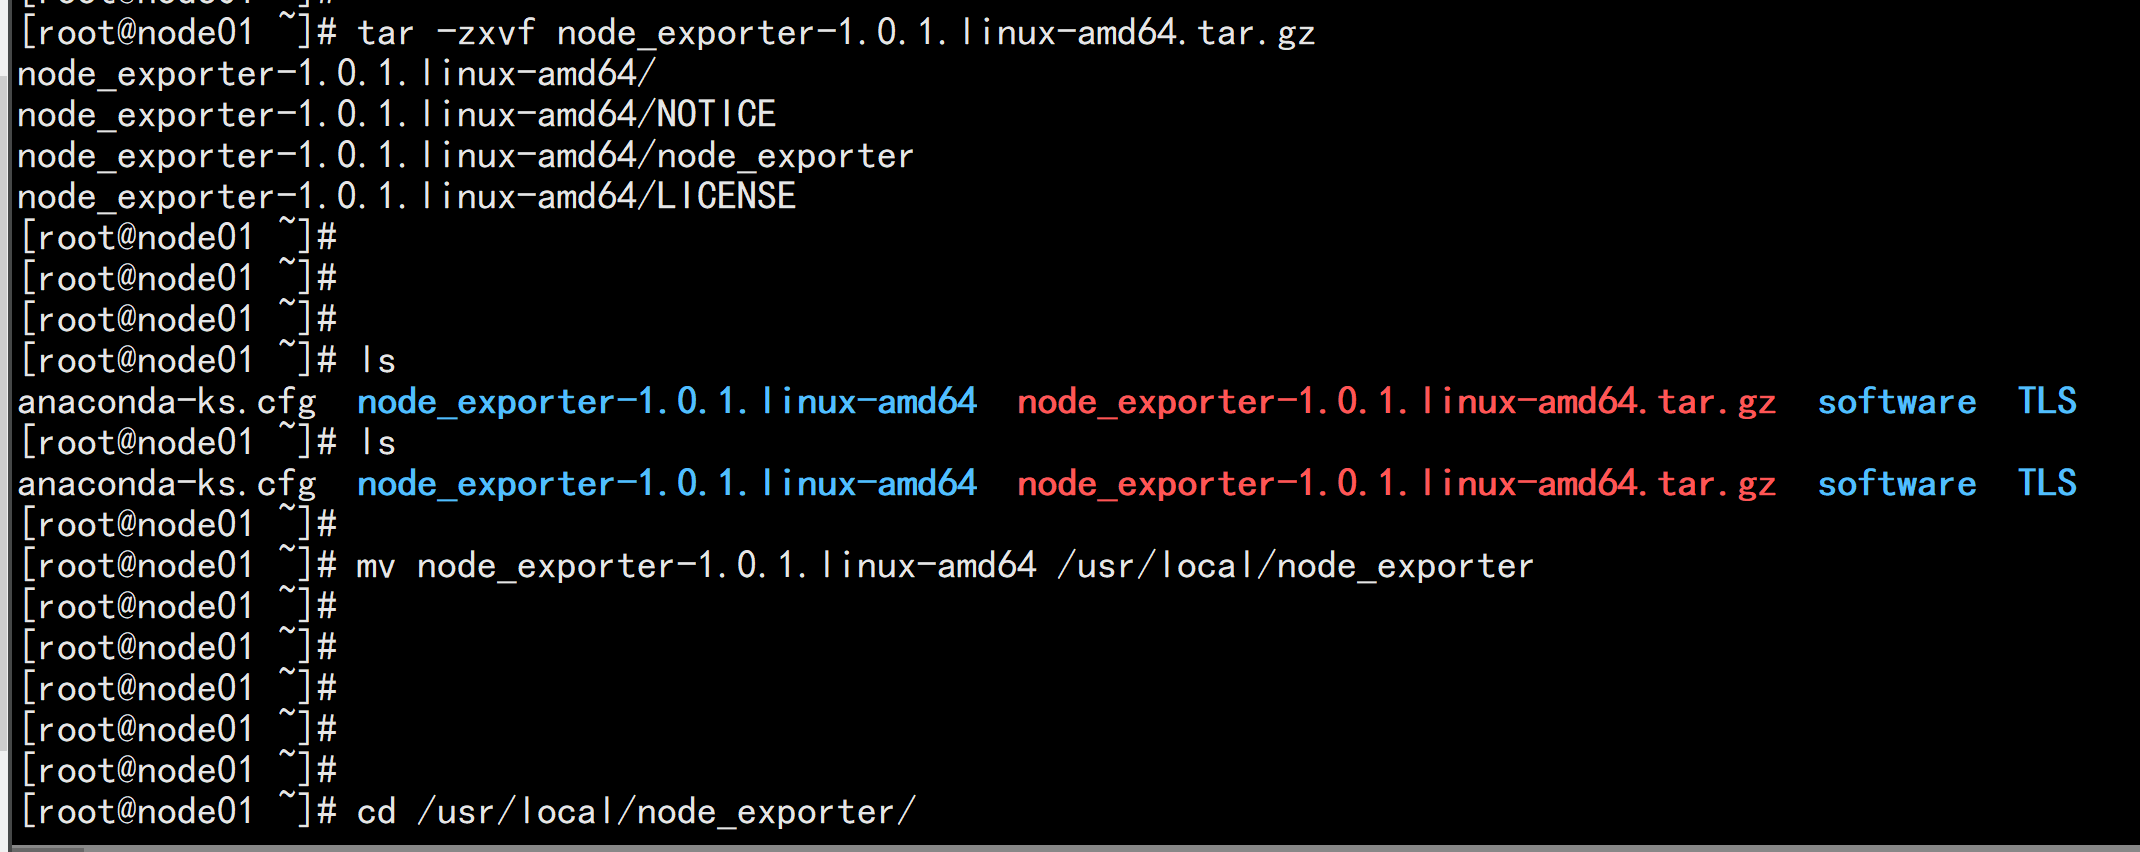
六:node_exporter使用
在客户端上面部署:tar -zxvf node_exporter-1.0.1.linux-amd64.tar.gzmv node_exporter-1.0.1.linux-amd64 /usr/local/node_exporter/usr/local/node_exporter/node_exporter &
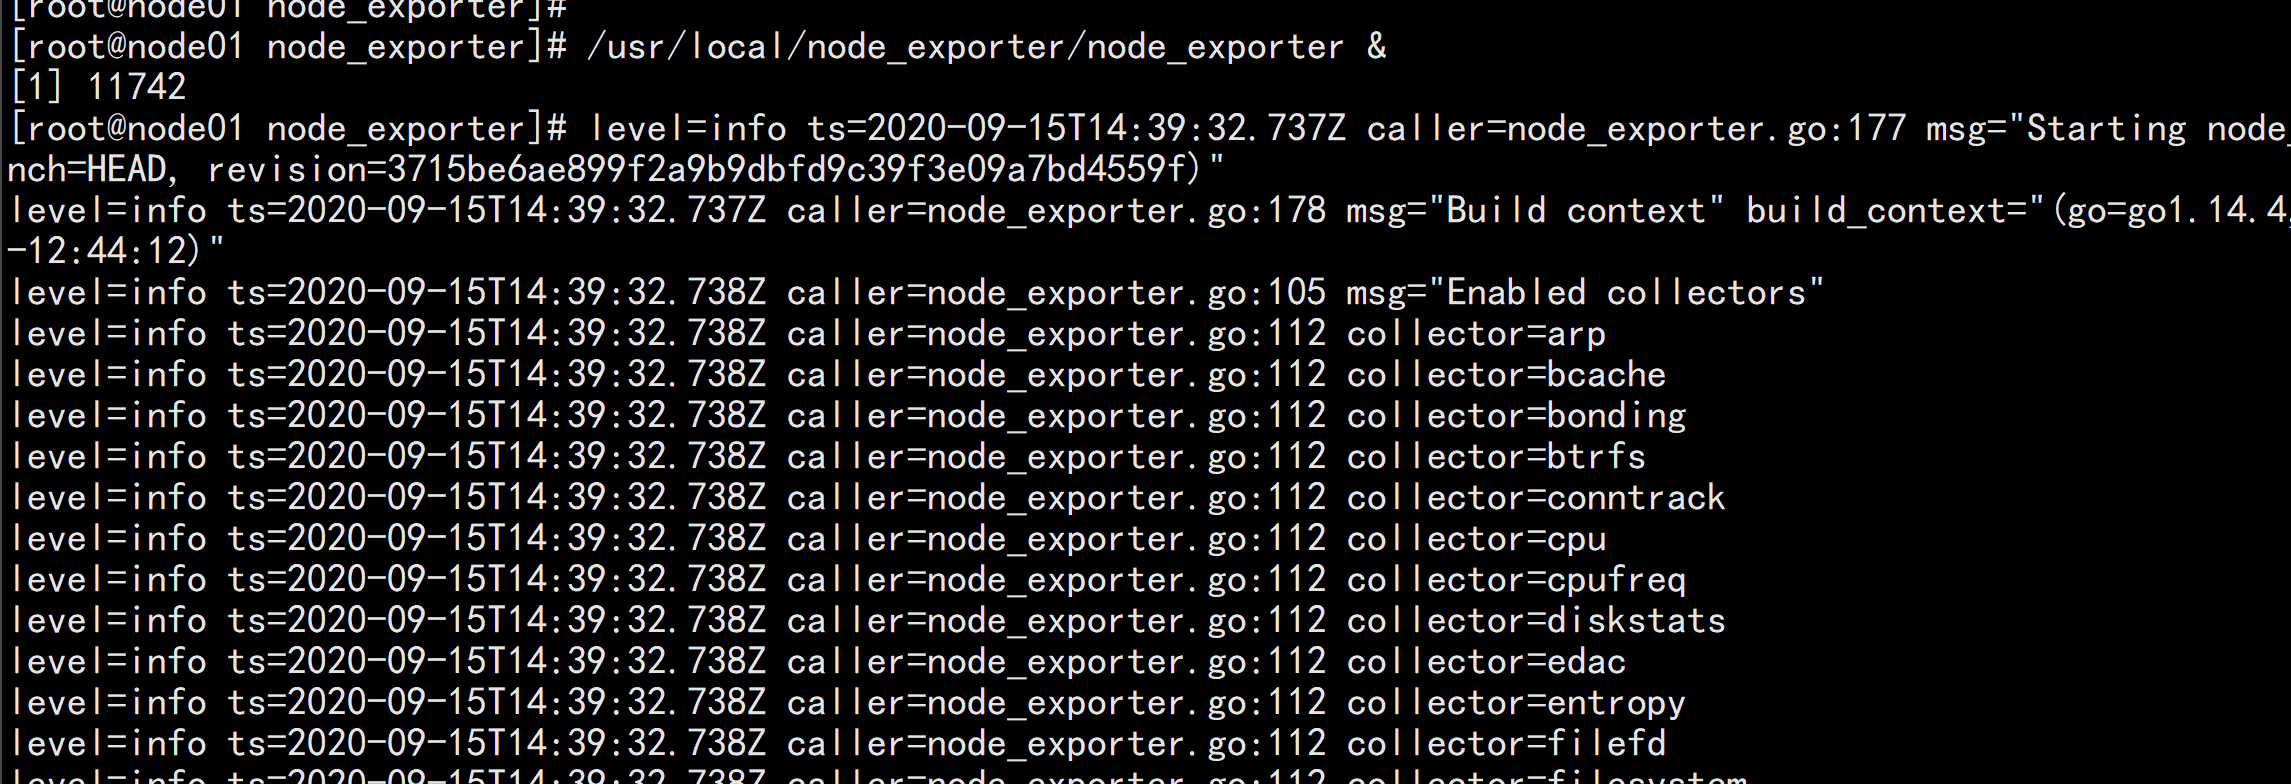
同理其它主机也一样部署
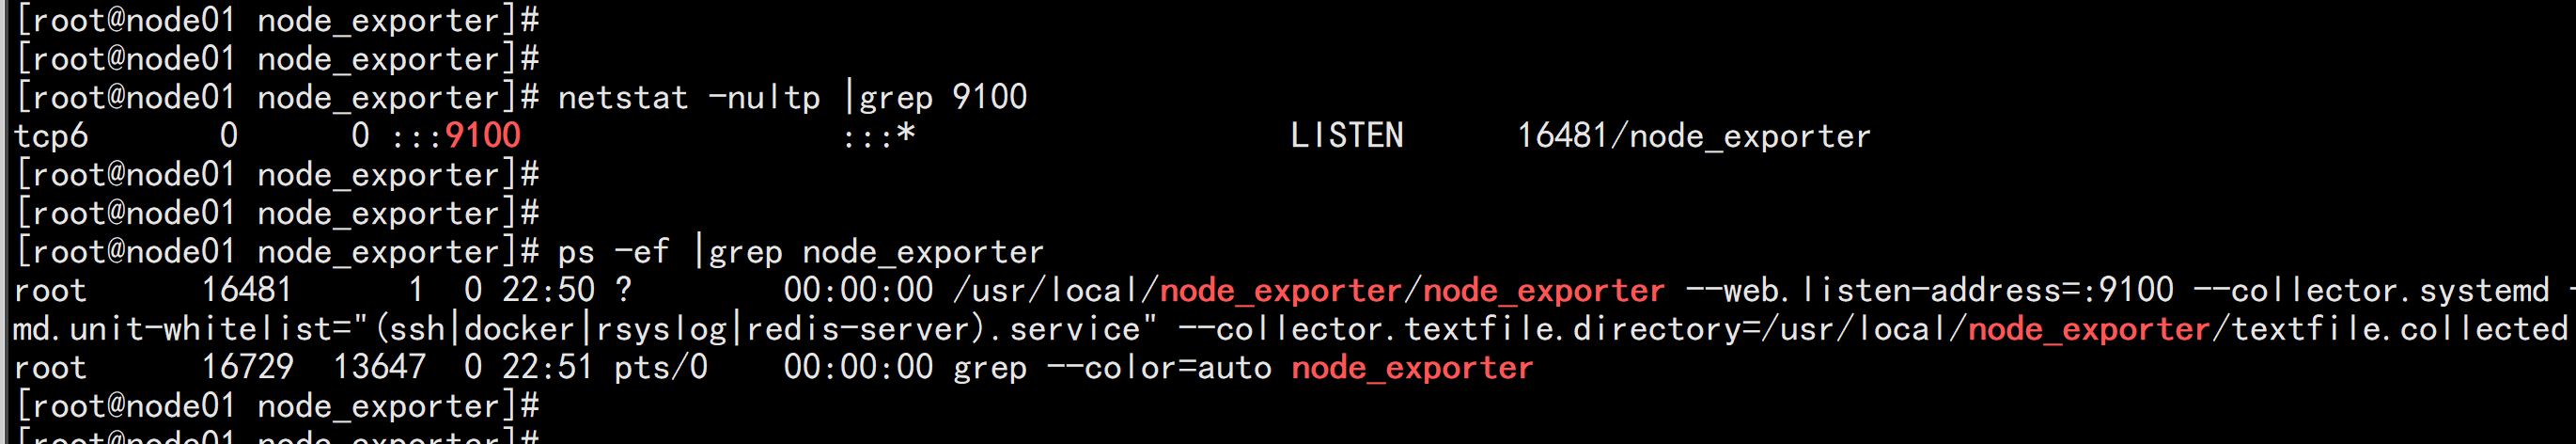
守护进程启动:cat > /usr/lib/systemd/system/node_exporter.service <<EOF[Unit]Description=node_exporter[Service]ExecStart=/usr/local/node_exporter/node_exporter \--web.listen-address=:9100 \--collector.systemd \--collector.systemd.unit-whitelist="(ssh|docker|rsyslog|redis-server).service" \--collector.textfile.directory=/usr/local/node_exporter/textfile.collectedRestart=on-failure[Install]WantedBy=multi-user.targetEOF

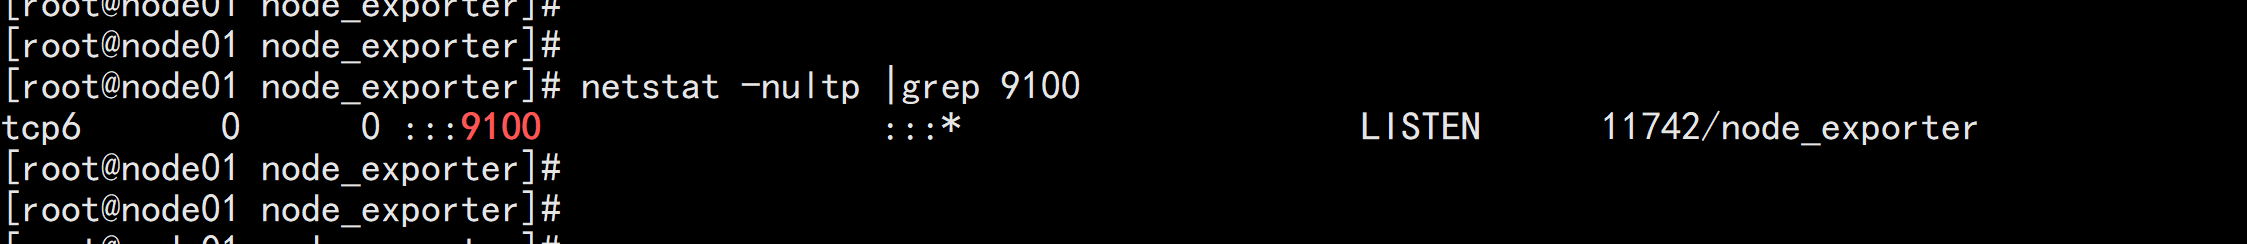
chmod +x /usr/lib/systemd/system/node_exporter.serviceservice node_exporter startchkconfig node_exporter onnetstat -nultp |grep 9100ps -ef |grep node_exporter
七: 启动参数 说明
二、启动参数说明1、启用systemd收集器systemd收集器记录systemd中的服务和系统状态。首先需要通过参数--collector.systemd启用该收集器,同时如果不希望收集所有的服务,只收集部分关键服务,node_exporter在启动时可以使用--collector.systemd.unit-whitelist参数配置指定的服务。2、指定textfile收集器目录使用textfile收集器可以让用户添加自定义的度量指标,功能类似pushgateway,同zabbix中自定义的item一样,只要将度量指标和值按照prometheus规范的格式输出到指定位置且以.prom后缀文件保存,textfile收集器会自动读取collector.textfile.directory目录下所有以.prom结尾的文件,并提取所有格式为Prometheus的指标暴露给Prometheus来抓取。textfile收集器默认是开启的,我们只需要指定--collector.textfile.directory的路径即可。--collector.textfile.directory=/usr/local/node_exporter/textfile.collected
例如,需要监控系统登录用户数# echo "node_login_users $(who |wc -l)" > /usr/local/node_exporter/textfile.collected/login_users.prom# echo "node_processes $(ps -ef |wc -l)" > /usr/local/node_exporter/textfile.collected/node_processes.prom以定时任务的方式采集*/1 * * * * echo "login_users $(who |wc -l)" > /usr/local/node_exporter/textfile.collected/login_users.prom*/1 * * * * echo "login_users $(who |wc -l)" >/usr/local/node_exporter/textfile.collected/node_processes.prom
3、启用或禁用收集器通过 ./node_exporter -h 命令,可以看到默认启用了哪些收集器(default: enabled),若要禁用某个收集器,如--collector.ntp,可以修改为 --no-collector.ntp,即禁用该收集器。
4、只添加指定收集器。node_exporter等各种收集器默认会收集非常多的指标数据,有很多并非我们所需要的,是可以不收集的,我们可以在启动node_exporter时指定禁用某些收集器,也可以在Prometheus的配置文件中(注意是Prometheus)的scrape_configs配置块下指定只收集哪些指标,配置格式大致如下:scrape_configs:- job_name: 'node_exporter'static_configs:- targets: ['node01:9100']params:collect[]:- cpu- meminfo- netstat- xfs详细配置可参照github文档(https://github.com/prometheus/node_exporter)。使用场景:只有在我们非常清楚每一个收集器用途时才使用该方法,官方推荐按默认收集所有数据,然后禁用某些不需要的收集器。
八: 监控系统资源的方法论
在google sre handbook中提出了评估系统是否存在问题,用户体验是否受影响,用四个黄金信号来判断:Latency(延迟)、Traffic(流量)、Errors(错误数)、Saturation(饱和度)。但在系统资源监控用得较多的方法是"USE"方法,分别表示为:Utilization(使用率)、Saturation(饱和度)、Errors(错误数)
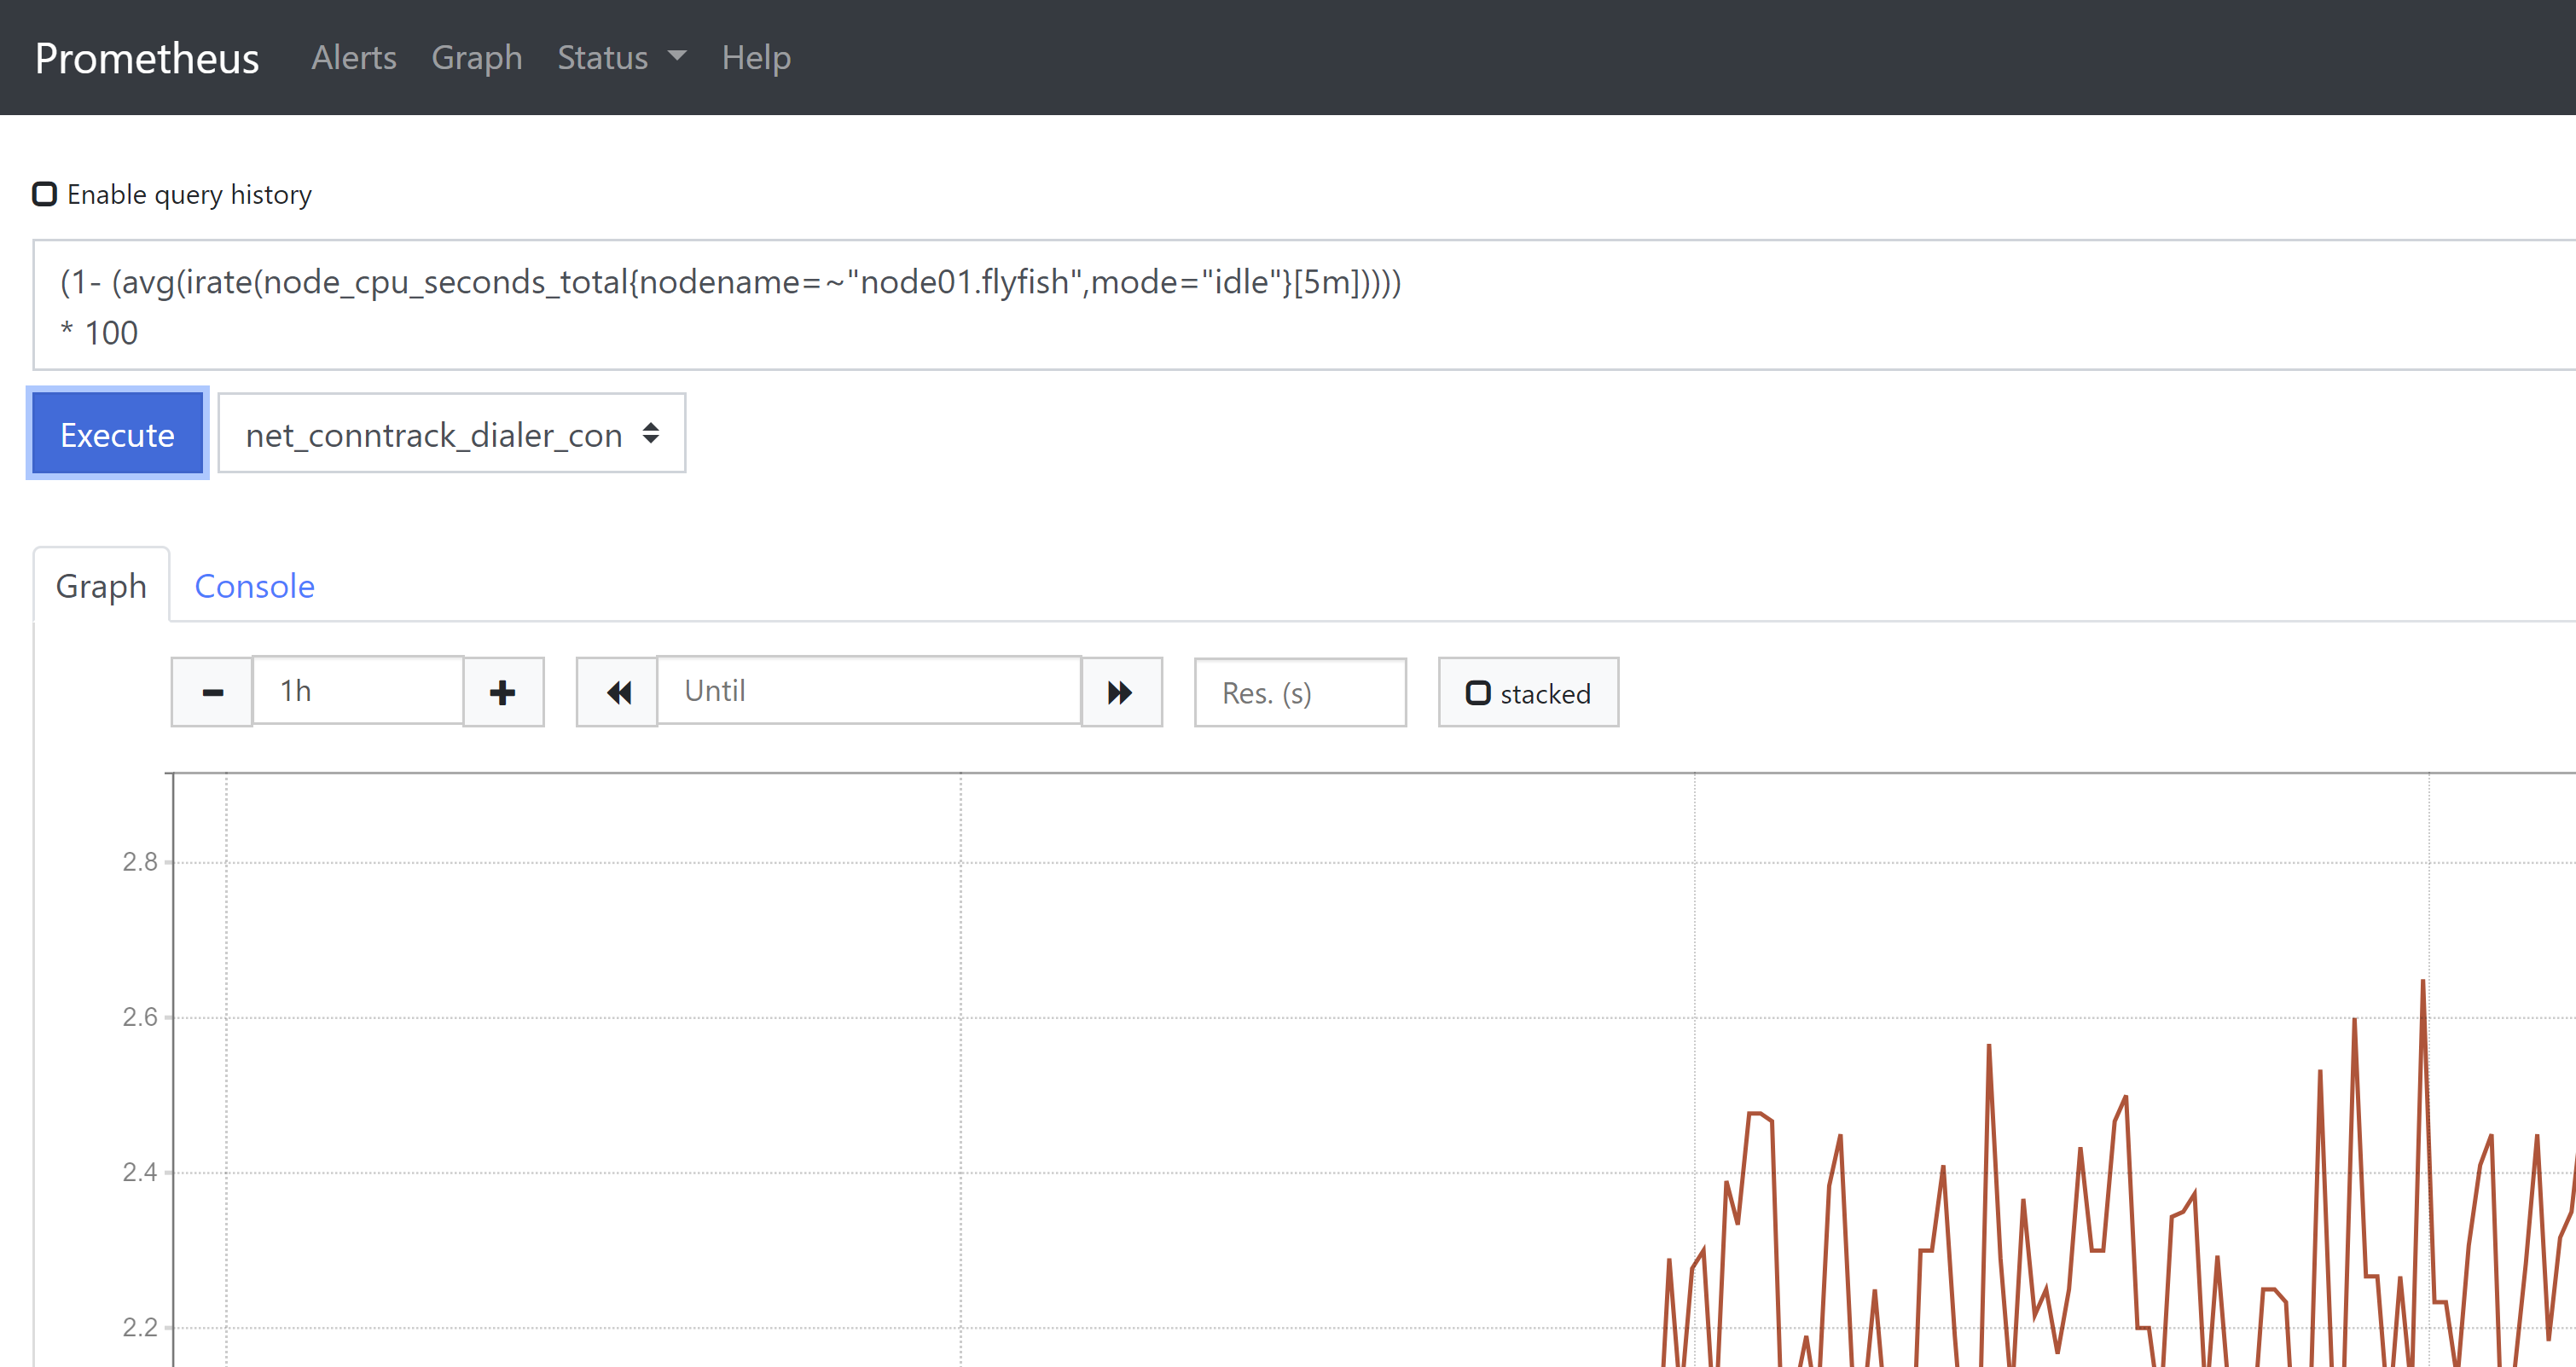
1、CPU使用率监控(1- (avg(irate(node_cpu_seconds_total{nodename=~"node01.flyfish",mode="idle"}[5m]))))* 100或者100 - (avg(irate(node_cpu_seconds_total{nodename=~"node01.flyfish",mode="idle"}[5m])) * 100)

2、内存使用率监控(1-(node_memory_MemAvailable_bytes{nodename="node01.flyfish"})/node_memory_MemTotal_bytes{nodename="node01.flyfish"} ) * 100或(node_memory_MemTotal_bytes{nodename="node01.flyfish"} -node_memory_MemAvailable_bytes{nodename="node01.flyfish"})/node_memory_MemTotal_bytes{nodename="node01.flyfish"} * 100如果将Buffers和Cached也作为可用内存,则内存使用率计算公式如下:(node_memory_MemTotal_bytes{nodename="node01.flyfish"} -(node_memory_MemFree_bytes{nodename="node01.flyfish"} +node_memory_Buffers_bytes{nodename="node01.flyfish"} +node_memory_Cached_bytes{nodename="node01.flyfish"}))/node_memory_MemTotal_bytes{nodename="node01.flyfish"} * 100
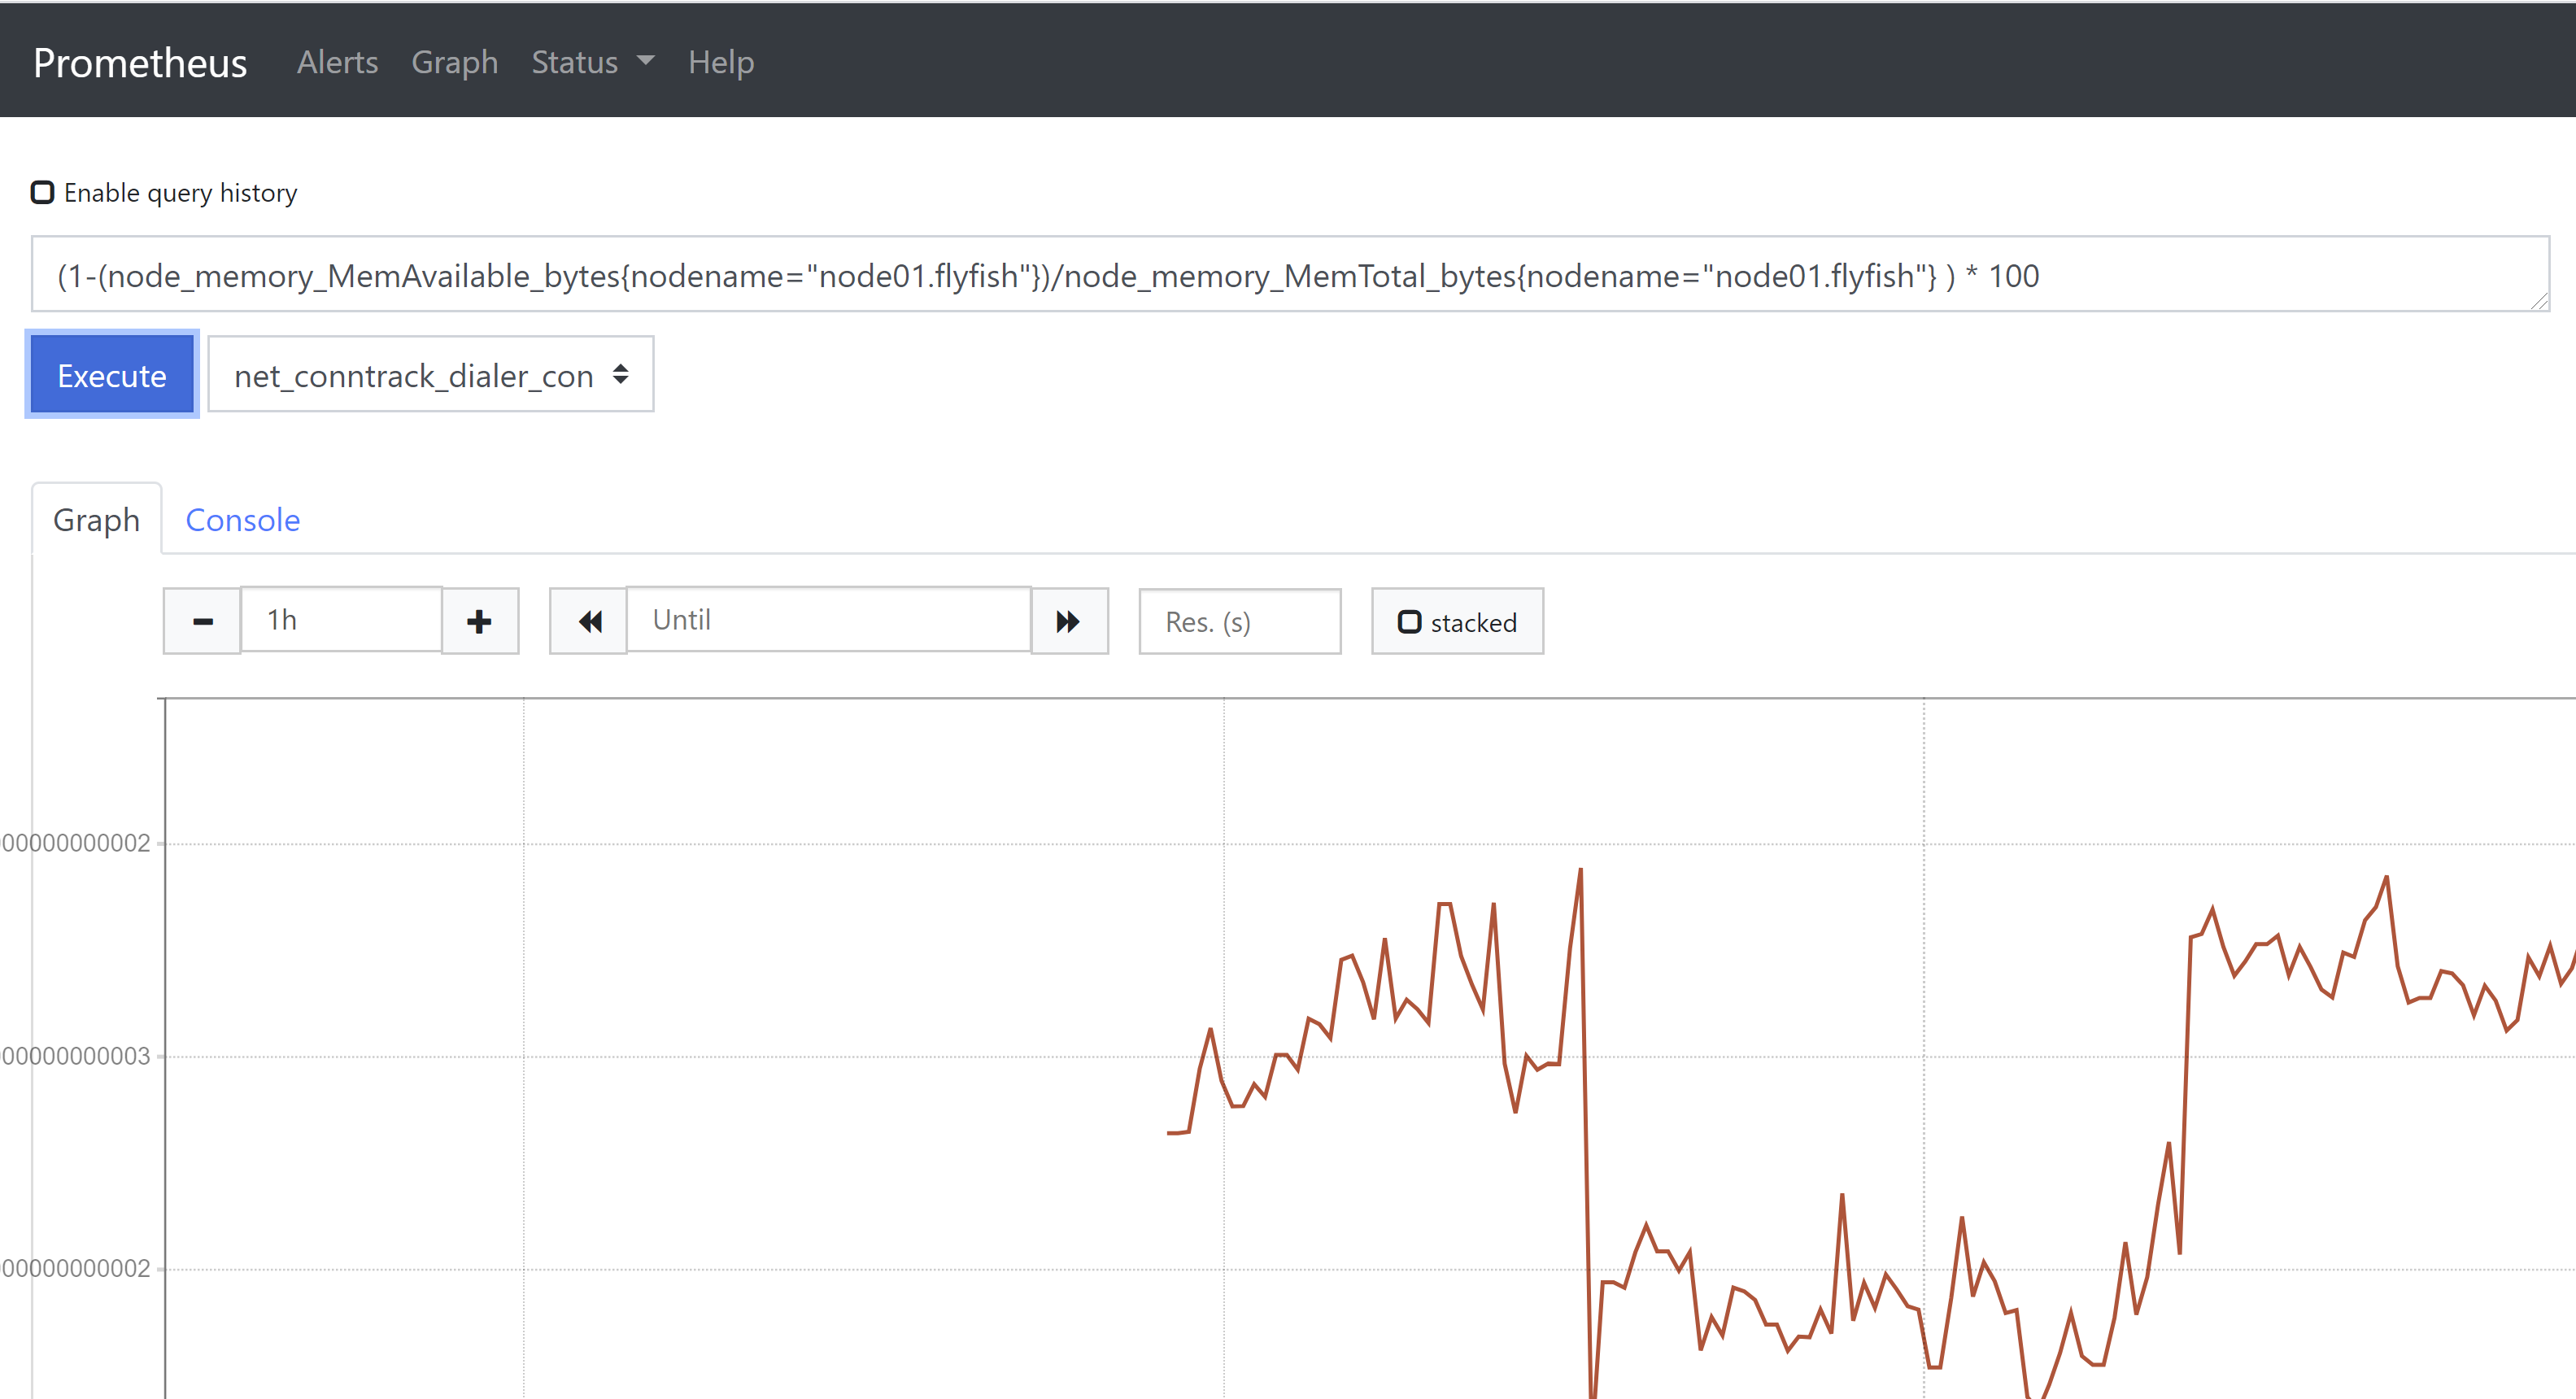
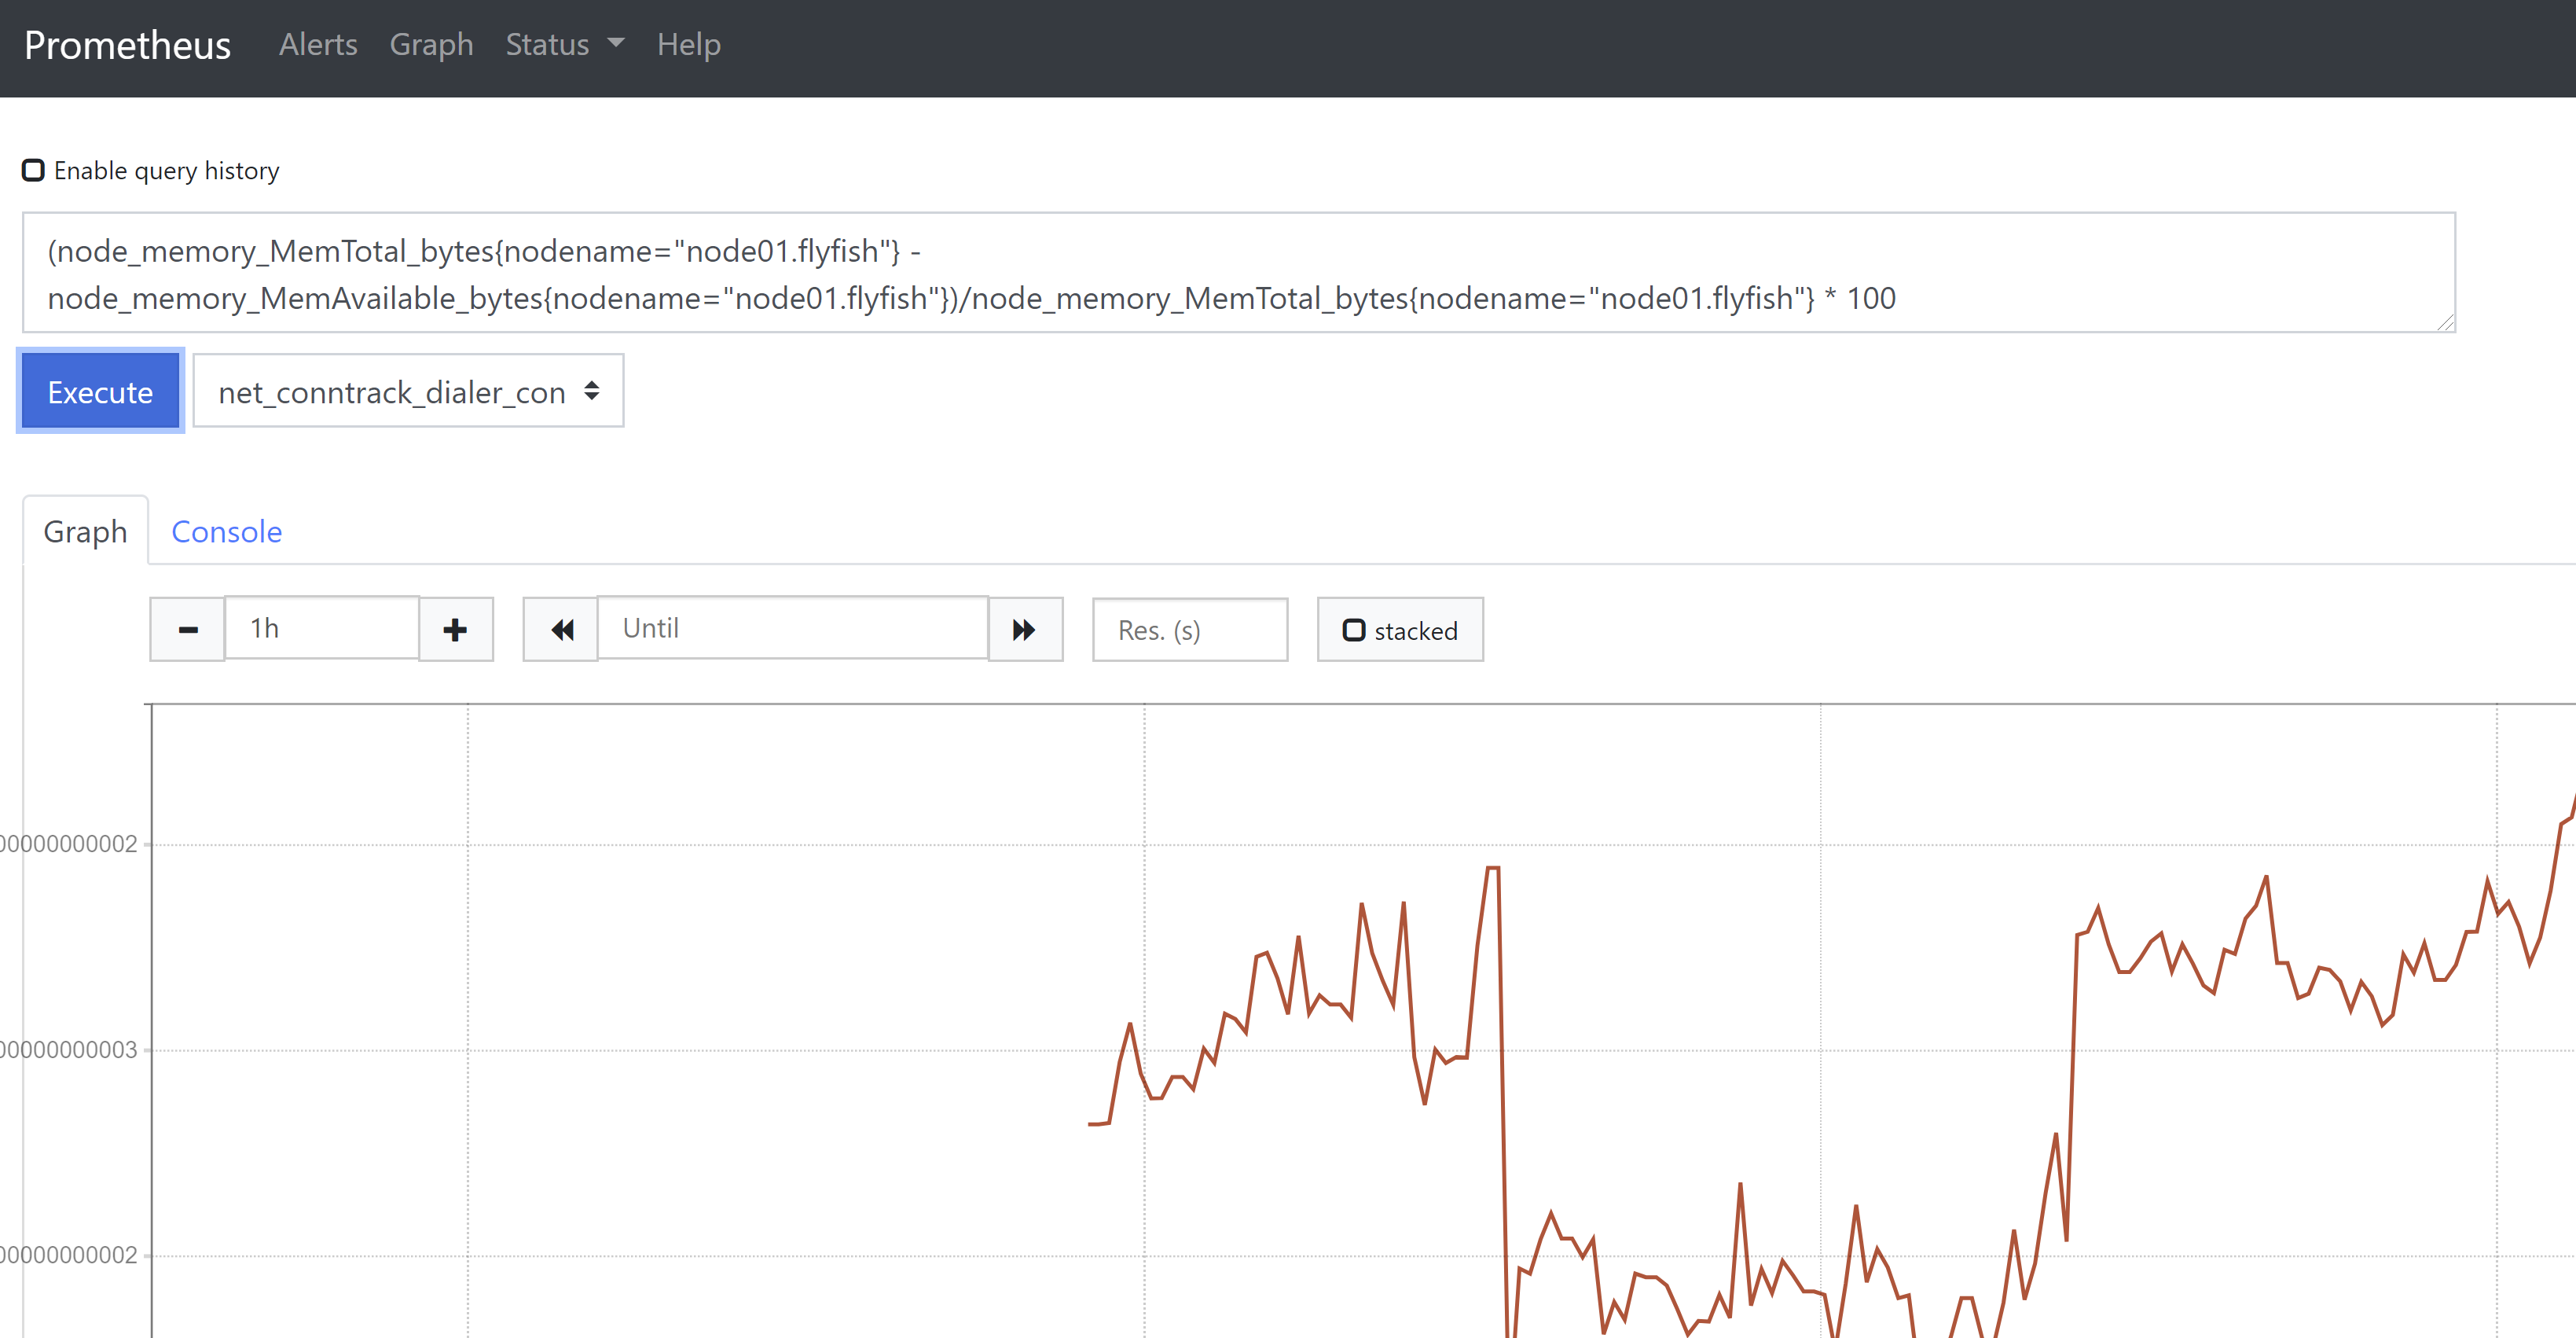
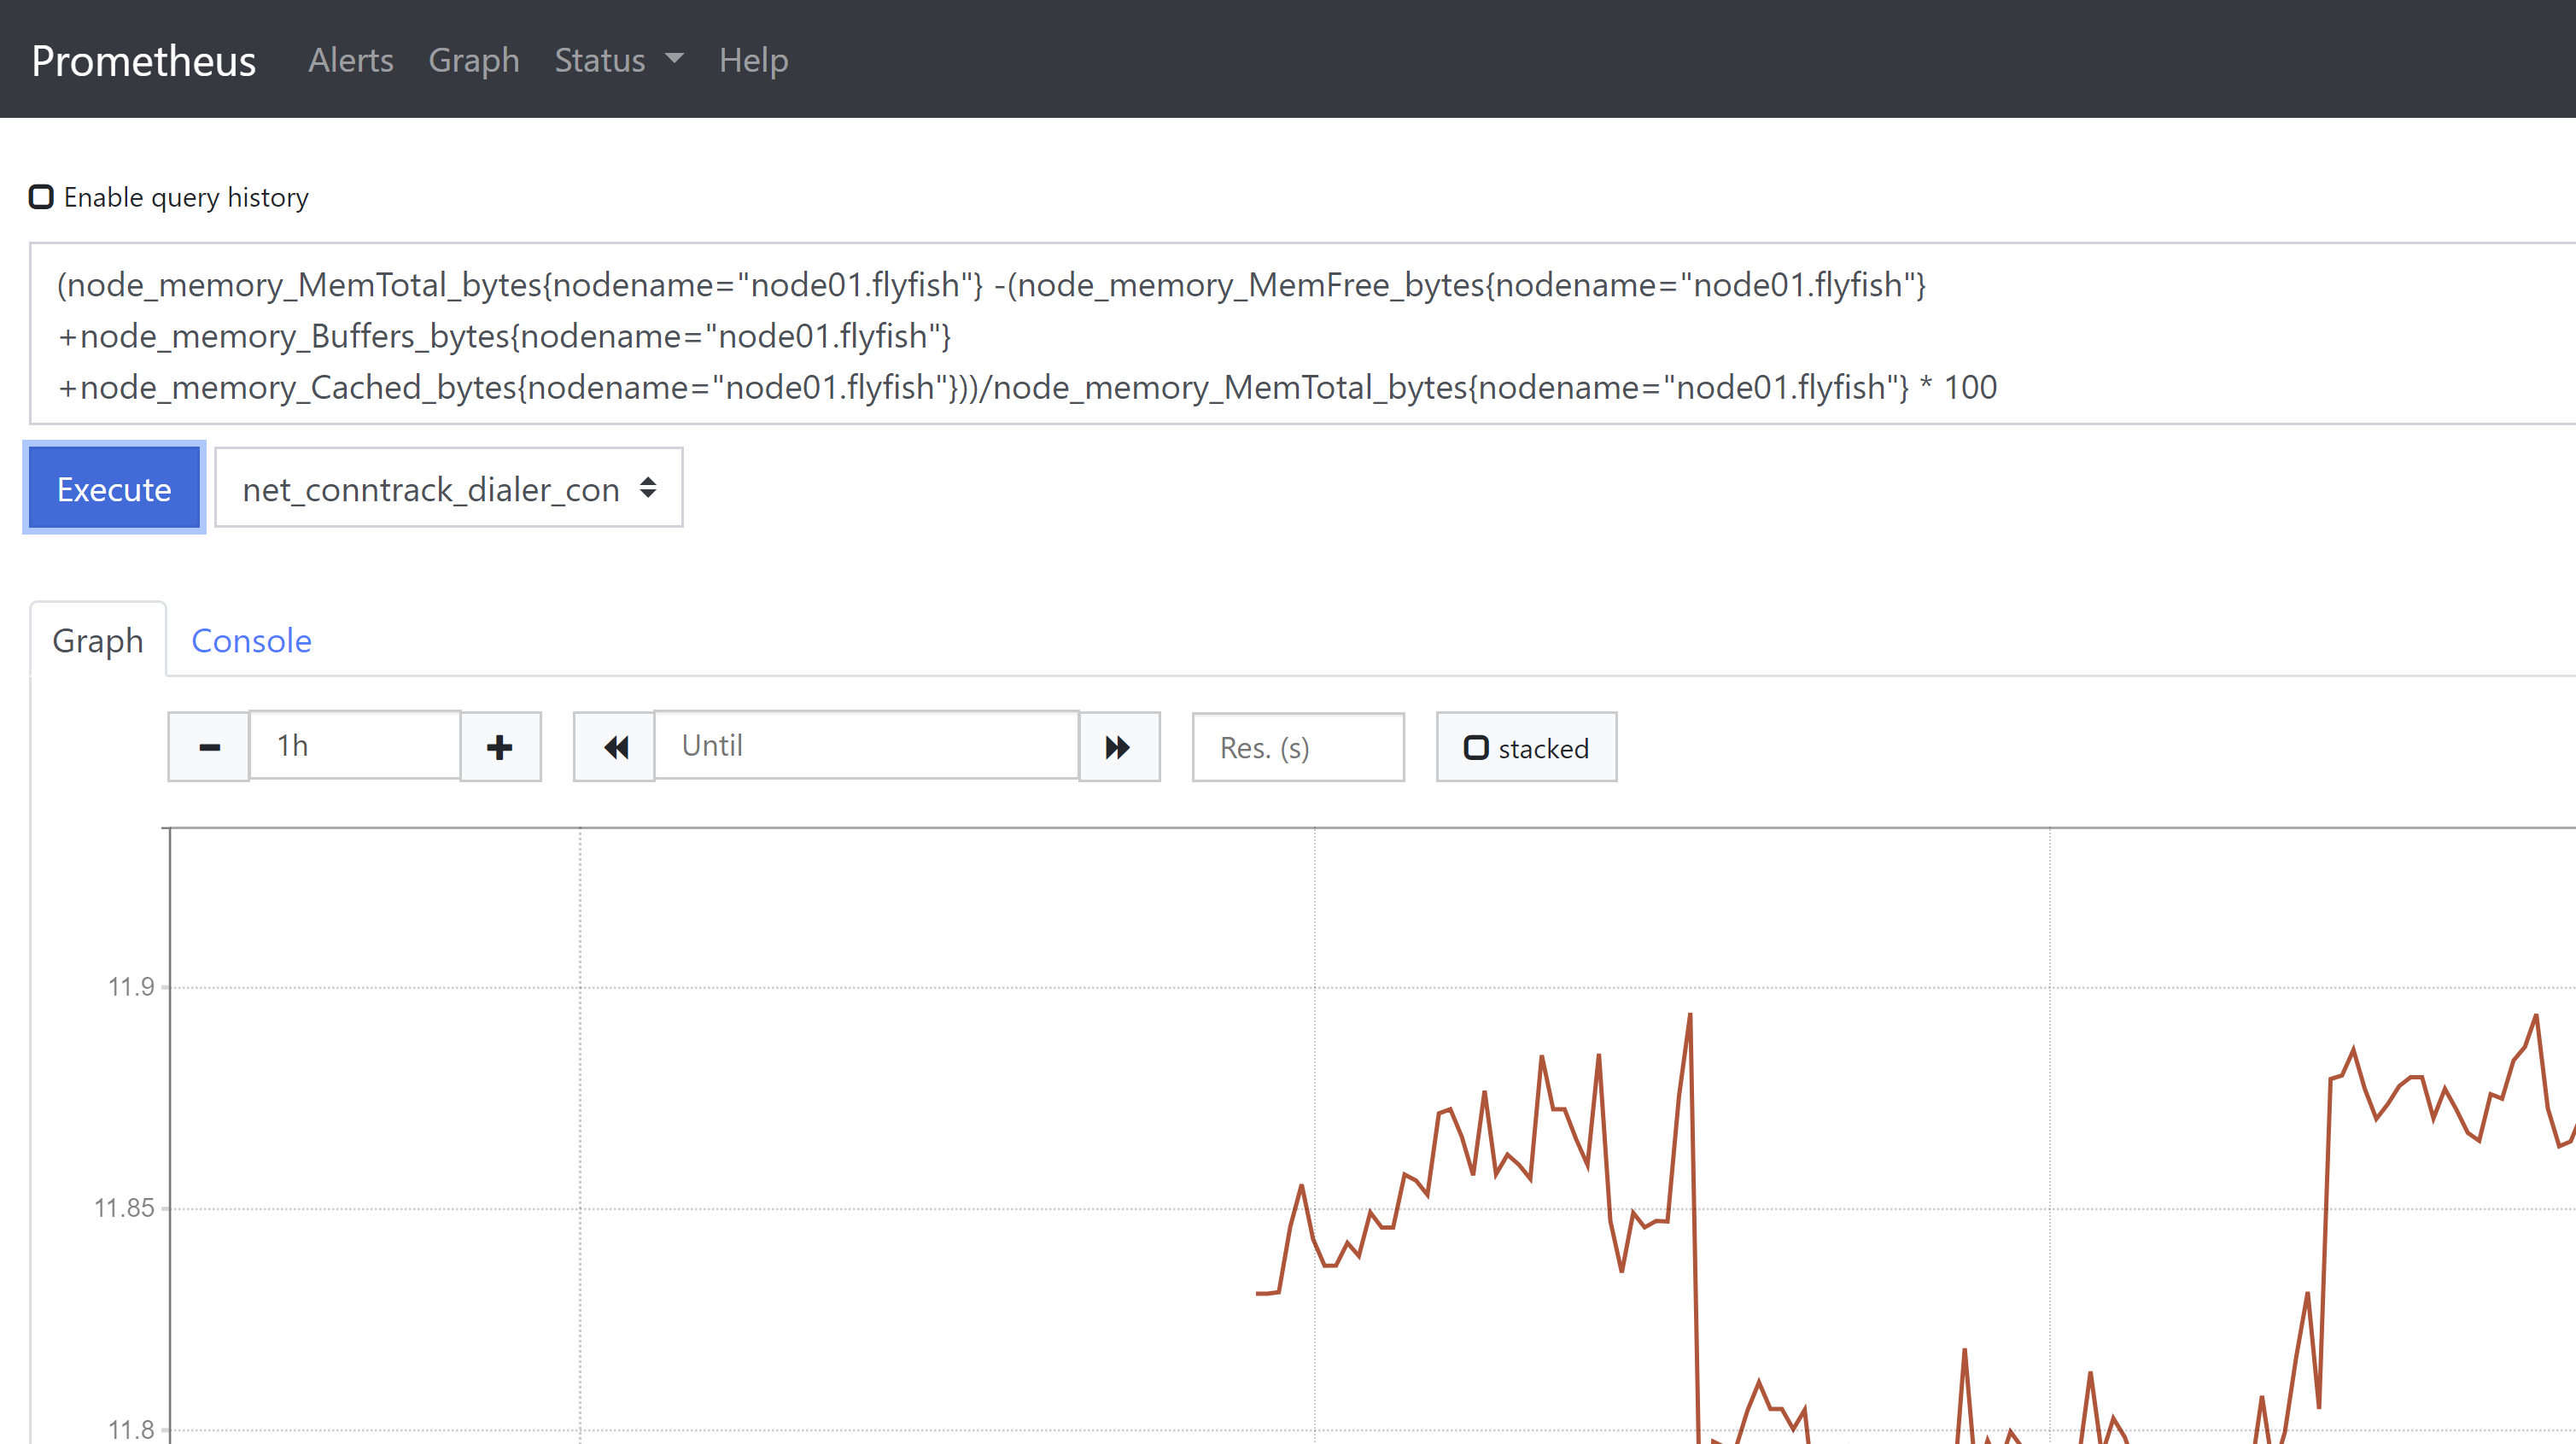
上述公式的标签名用nodename来替换了instance,因为在prometheus中配置时,instance和job都按缺省取默认值。
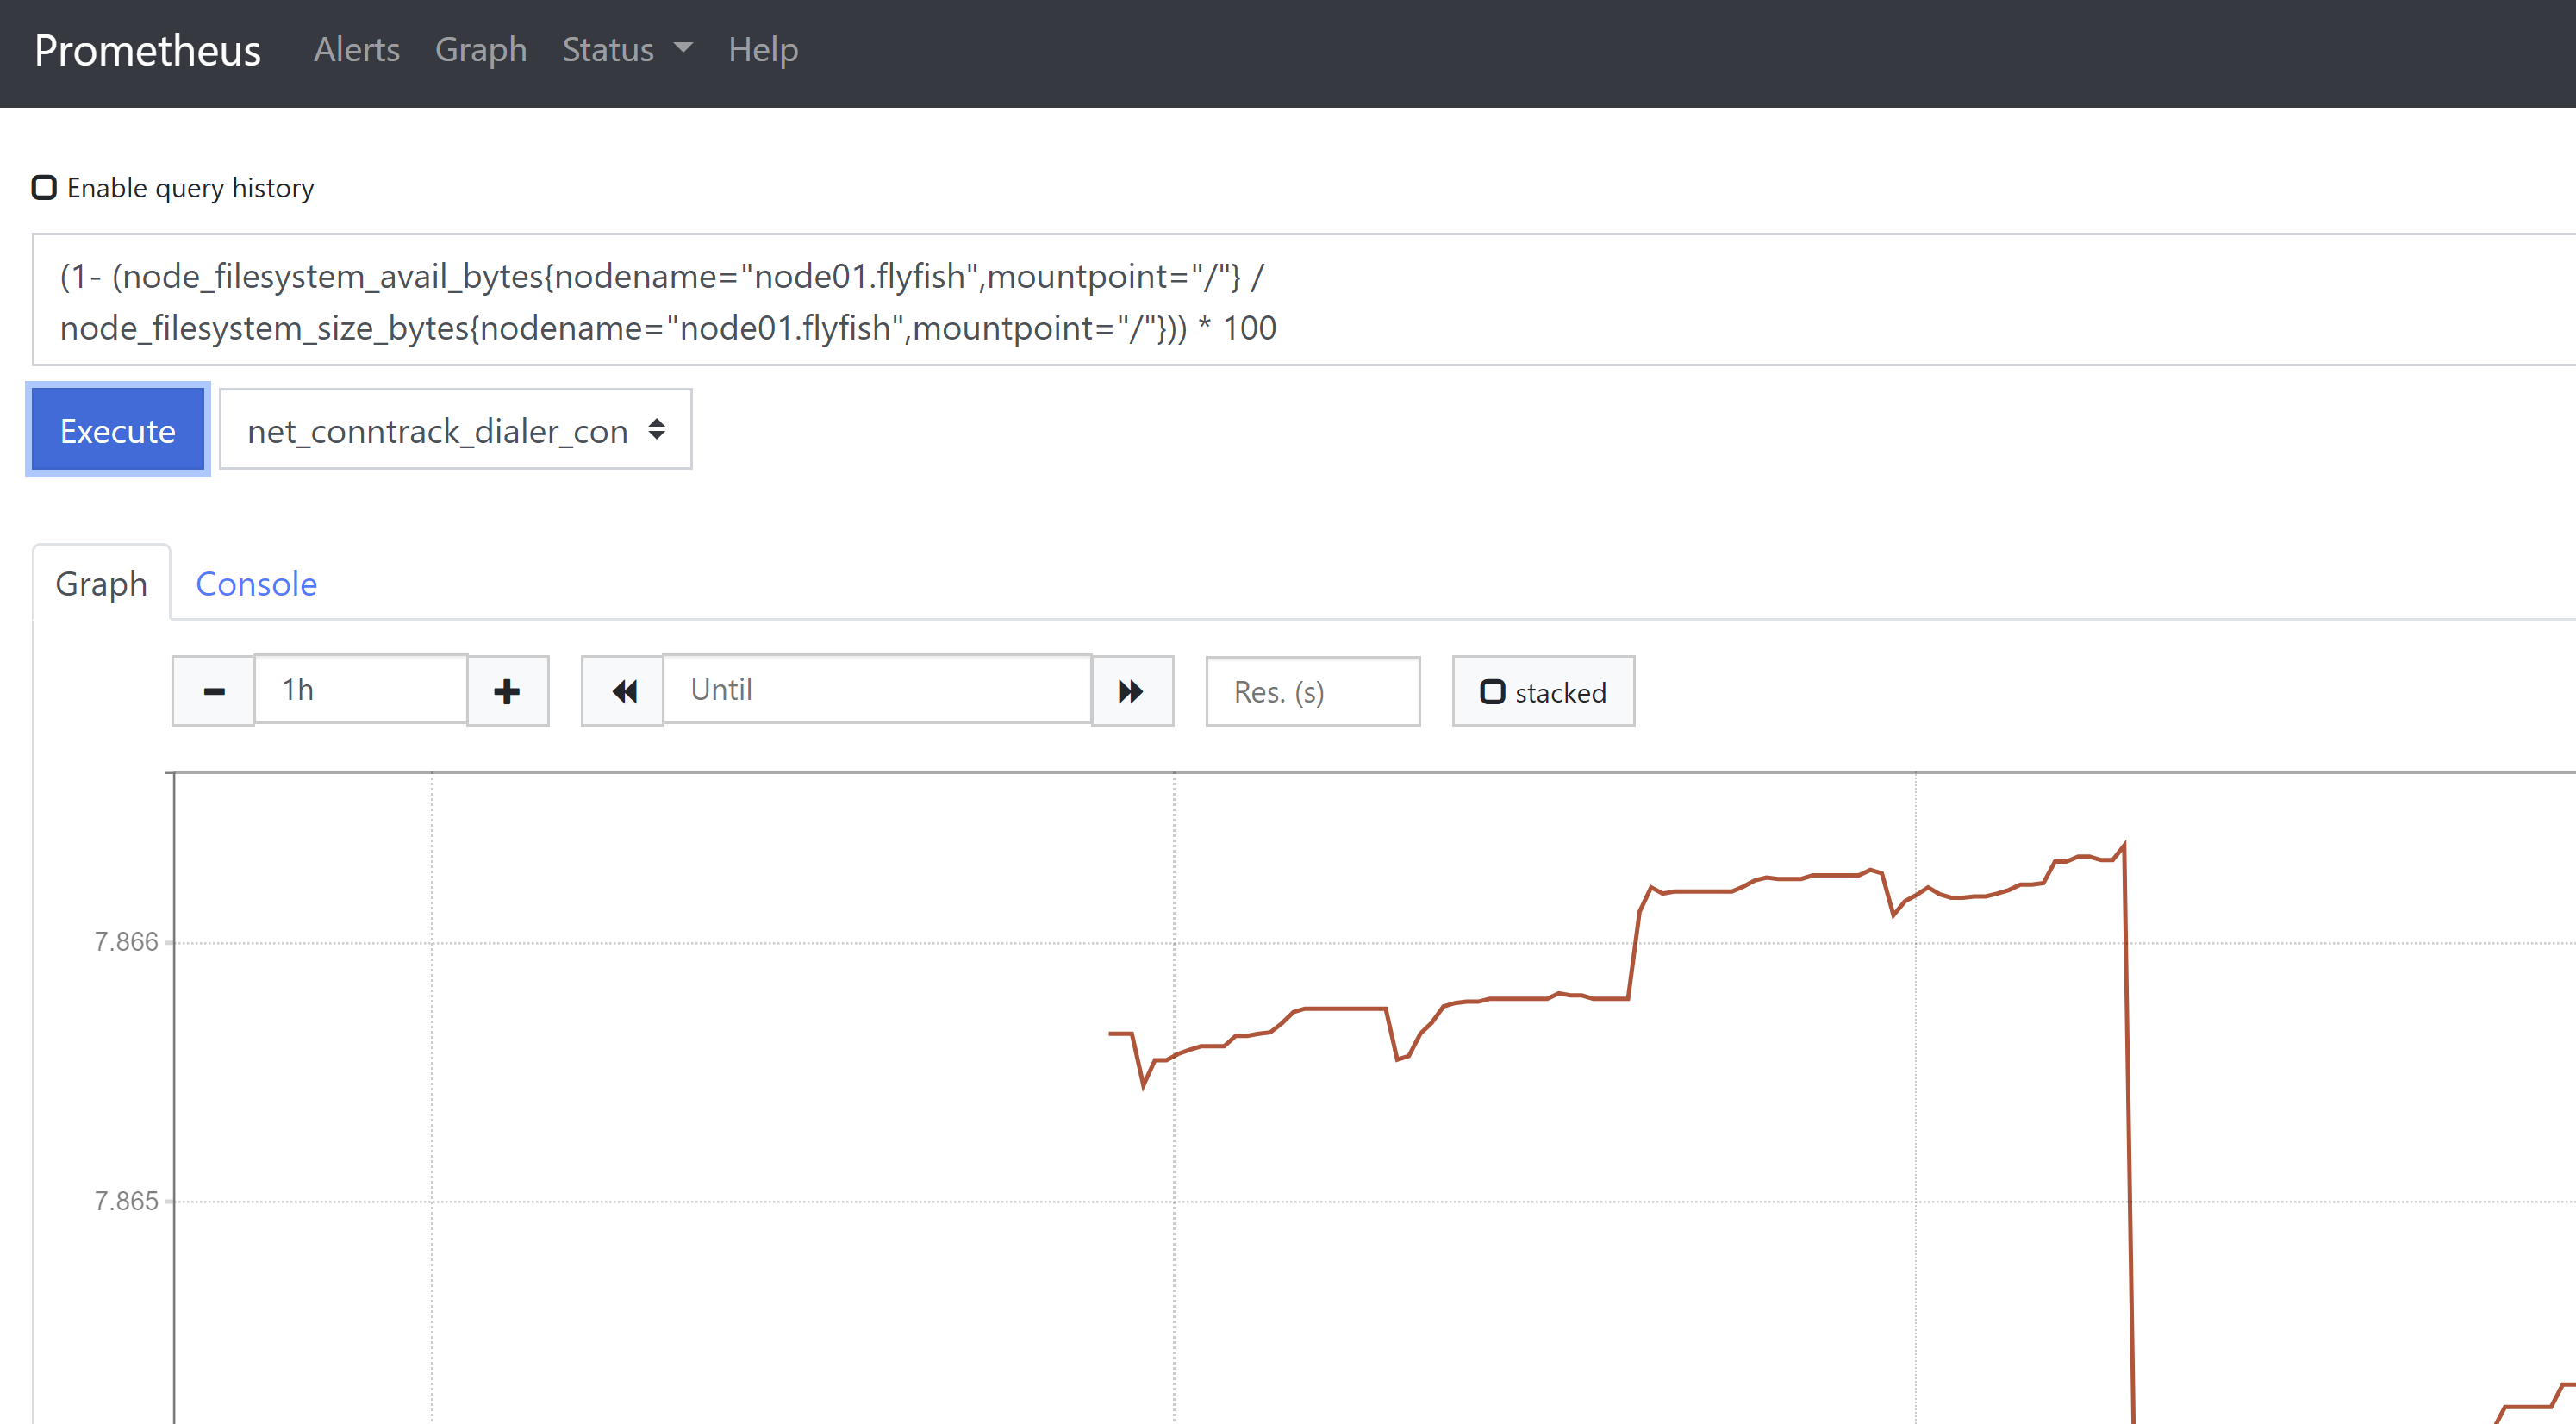
3、磁盘分区使用率监控(1- (node_filesystem_avail_bytes{nodename="node01.flyfish",mountpoint="/"} /node_filesystem_size_bytes{nodename="node01.flyfish",mountpoint="/"})) * 100磁盘使用预测predict_linear()函数,根据前一个时间段的值来预测未来某个时间点数据的走势。predict_linear(node_filesystem_free_bytes{device="rootfs",nodename=~"node01.flyfish",mountpoint="/"}[1d],24*3600) /(1024*1024*1024)上面这个表达式含义是根据近1天的磁盘空闲情况,预测在明天的这个时间磁盘还空闲多少。测试:dd if=/dev/zero of=/disktest bs=1024 count=2097152
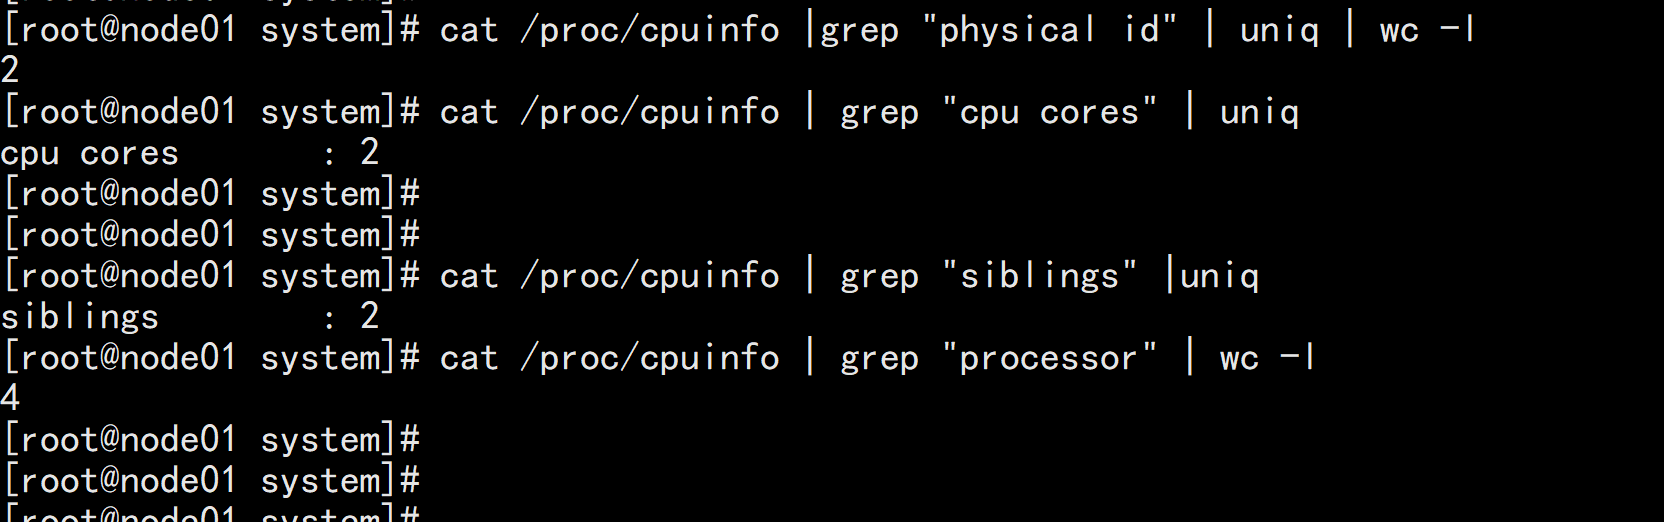
4、CPU饱和度监控CPU饱和度通常是按系统的平均负载来衡量,如观察主机CPU数量(通常按逻辑CPU来算)在一段时间内平均运行的队列长度,当平均负载小于vCPU数量则认为是正常的,若负载长时间超出CPU的数量则认为CPU饱和。我们先来看看如何查看主机的物理CPU个数、每个物理CPU的核数、每个物理CPU有多少个逻辑CPU(购买云主机时的vcpu数或叫线程数)。通过过滤"physical id"查看物理CPU数# cat /proc/cpuinfo |grep "physical id" | uniq | wc -l通过过滤"cpu cores"查看每个物理CPU有多个核数# cat /proc/cpuinfo | grep "cpu cores" | uniq通过过滤"siblings"查看每个物理CPU下有多少个逻辑CPU数# cat /proc/cpuinfo | grep "siblings" |uniq或者通过过滤"processor"查看所有物理cpu下的逻辑cpu个数# cat /proc/cpuinfo | grep "processor" | wc -l
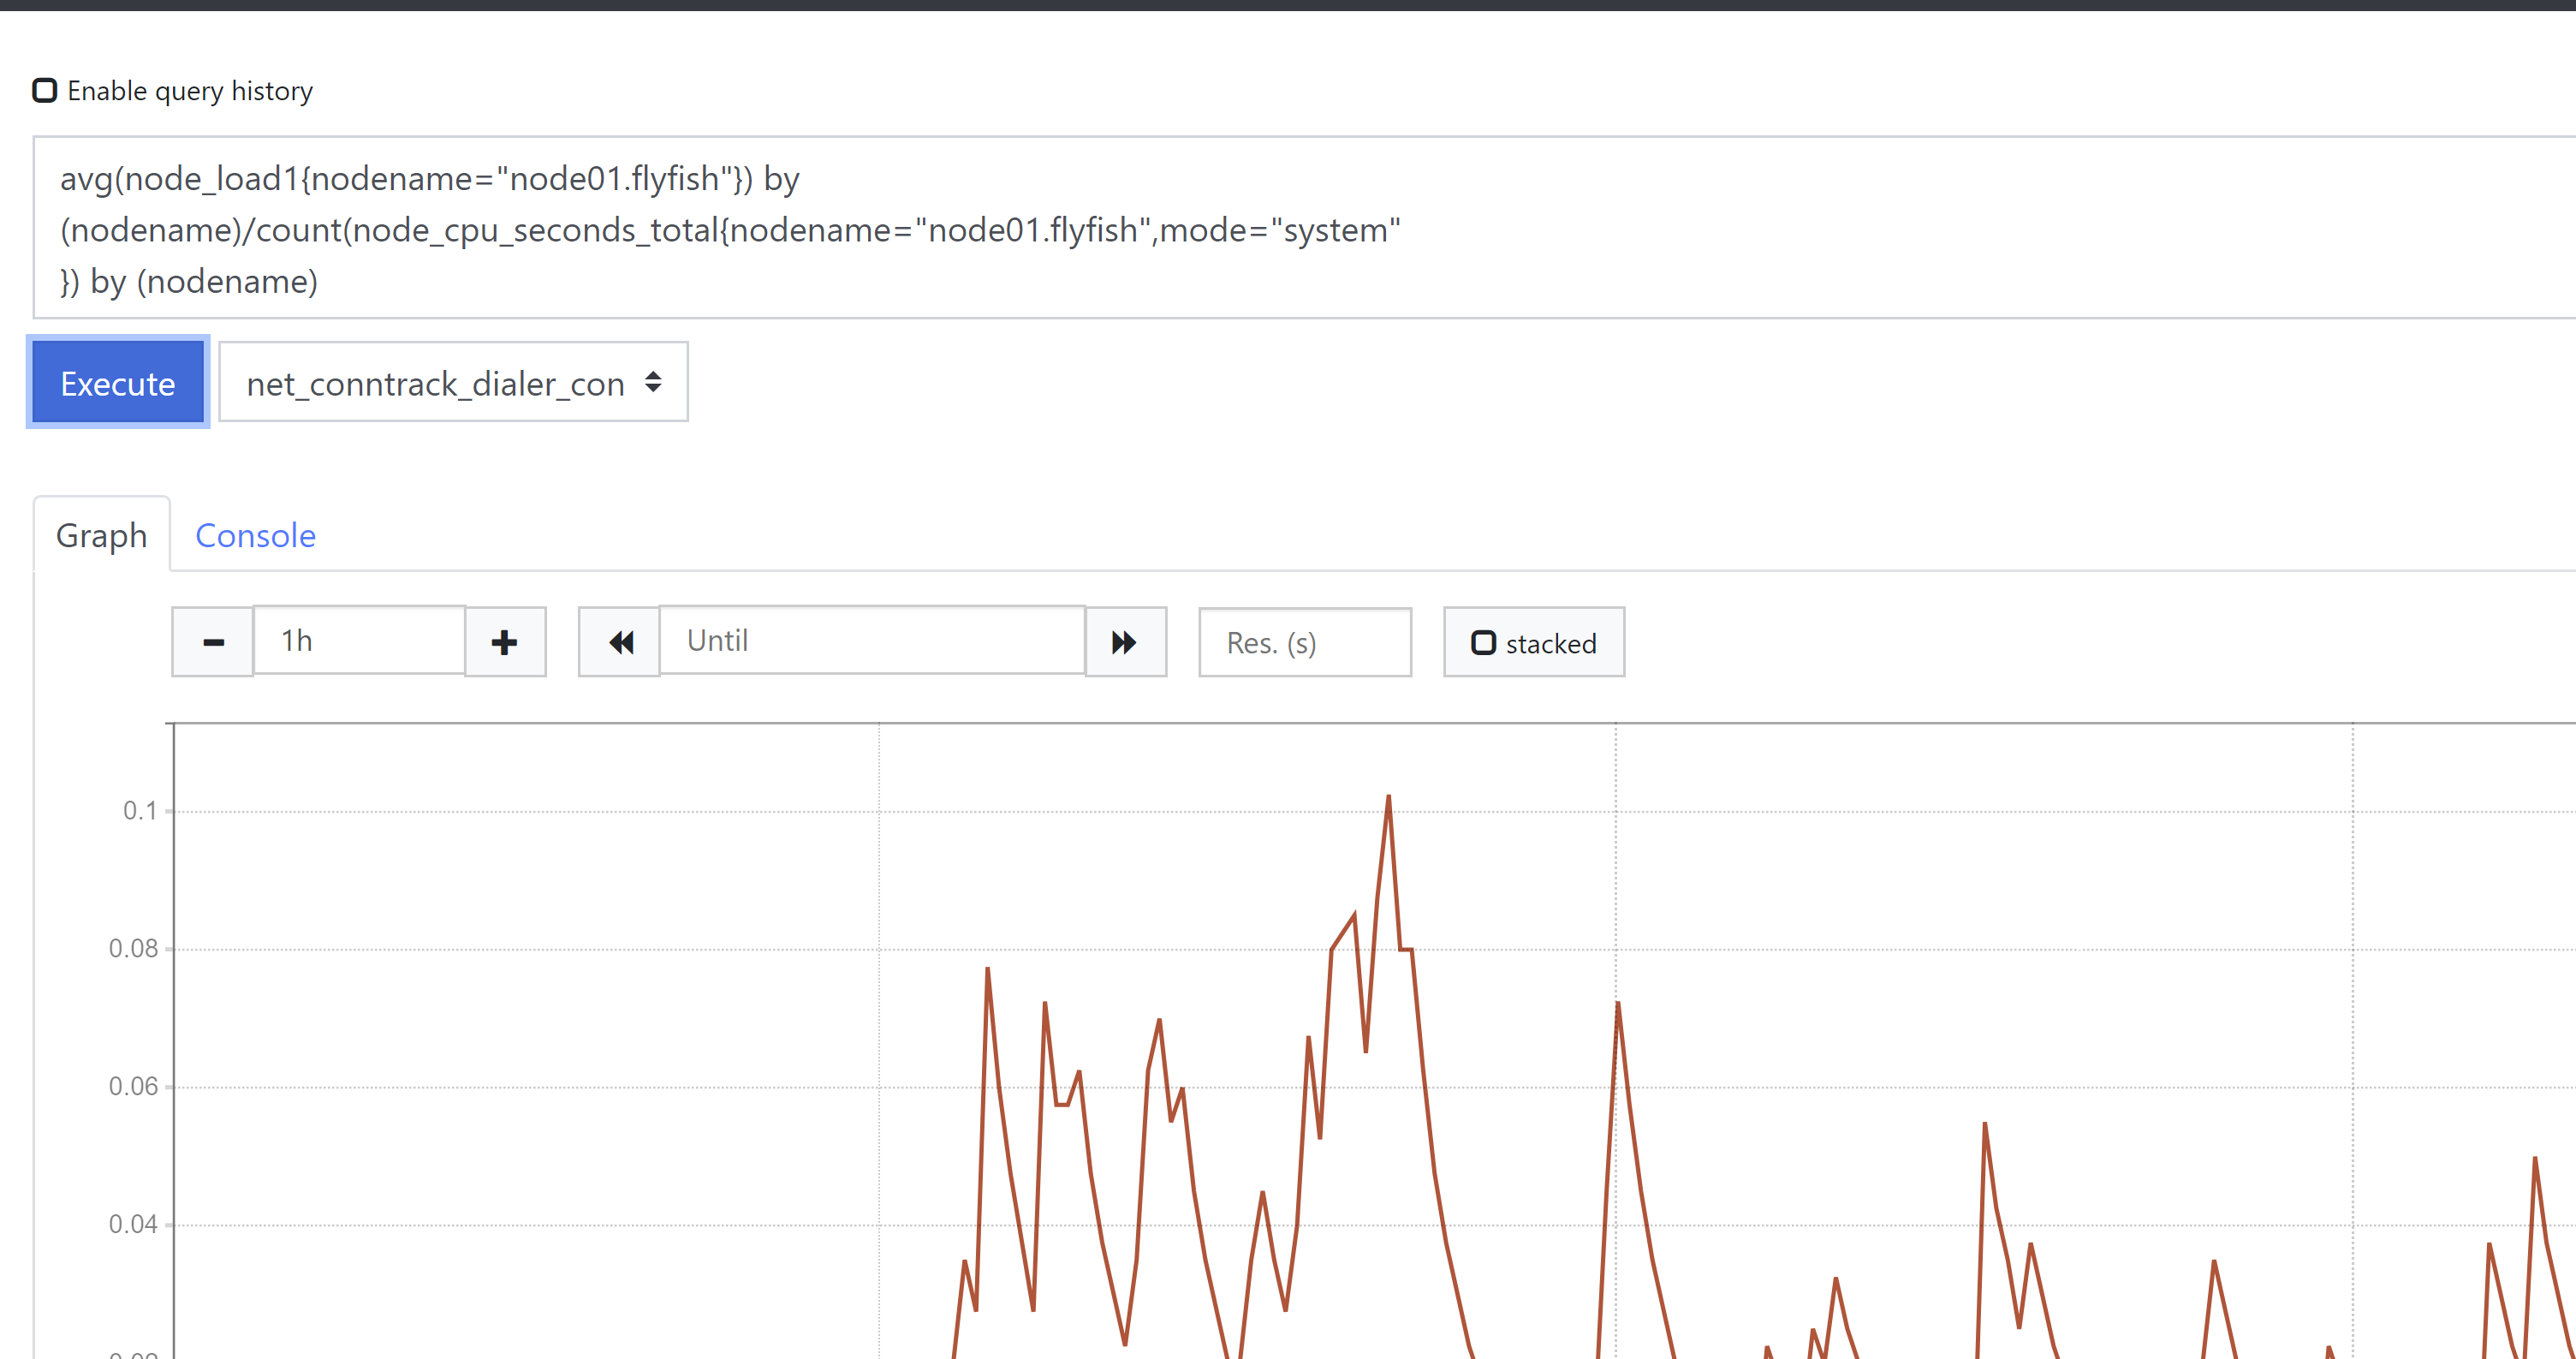
CPU饱和度监控avg(node_load1{nodename="node01.flyfish"}) by(nodename)/count(node_cpu_seconds_total{nodename="node01.flyfish",mode="system"}) by (nodename)或者以下这种写法avg(node_load1{nodename="node01.flyfish"})/count(node_cpu_seconds_total{nodename="node01.flyfish",mode="system"})

5、内存饱和度可以用下面这两个指标来评估内存饱和度。node_vmstat_pswpin:系统每秒从swap读到内存的字节数,读取的是/proc/vmstat下的pswpin(si),单位是KB/s 。node_vmstat_pswpout:系统每秒从内存写到swap字节数,读取的是/proc/vmstat下的pswpout(so),单位是KB/s。内存饱和度计算,个人理解是上面2个指标之和大于0时表示已使用到交换分区,内存达到饱和?但如果交换分区未启用该如何计算饱和度?
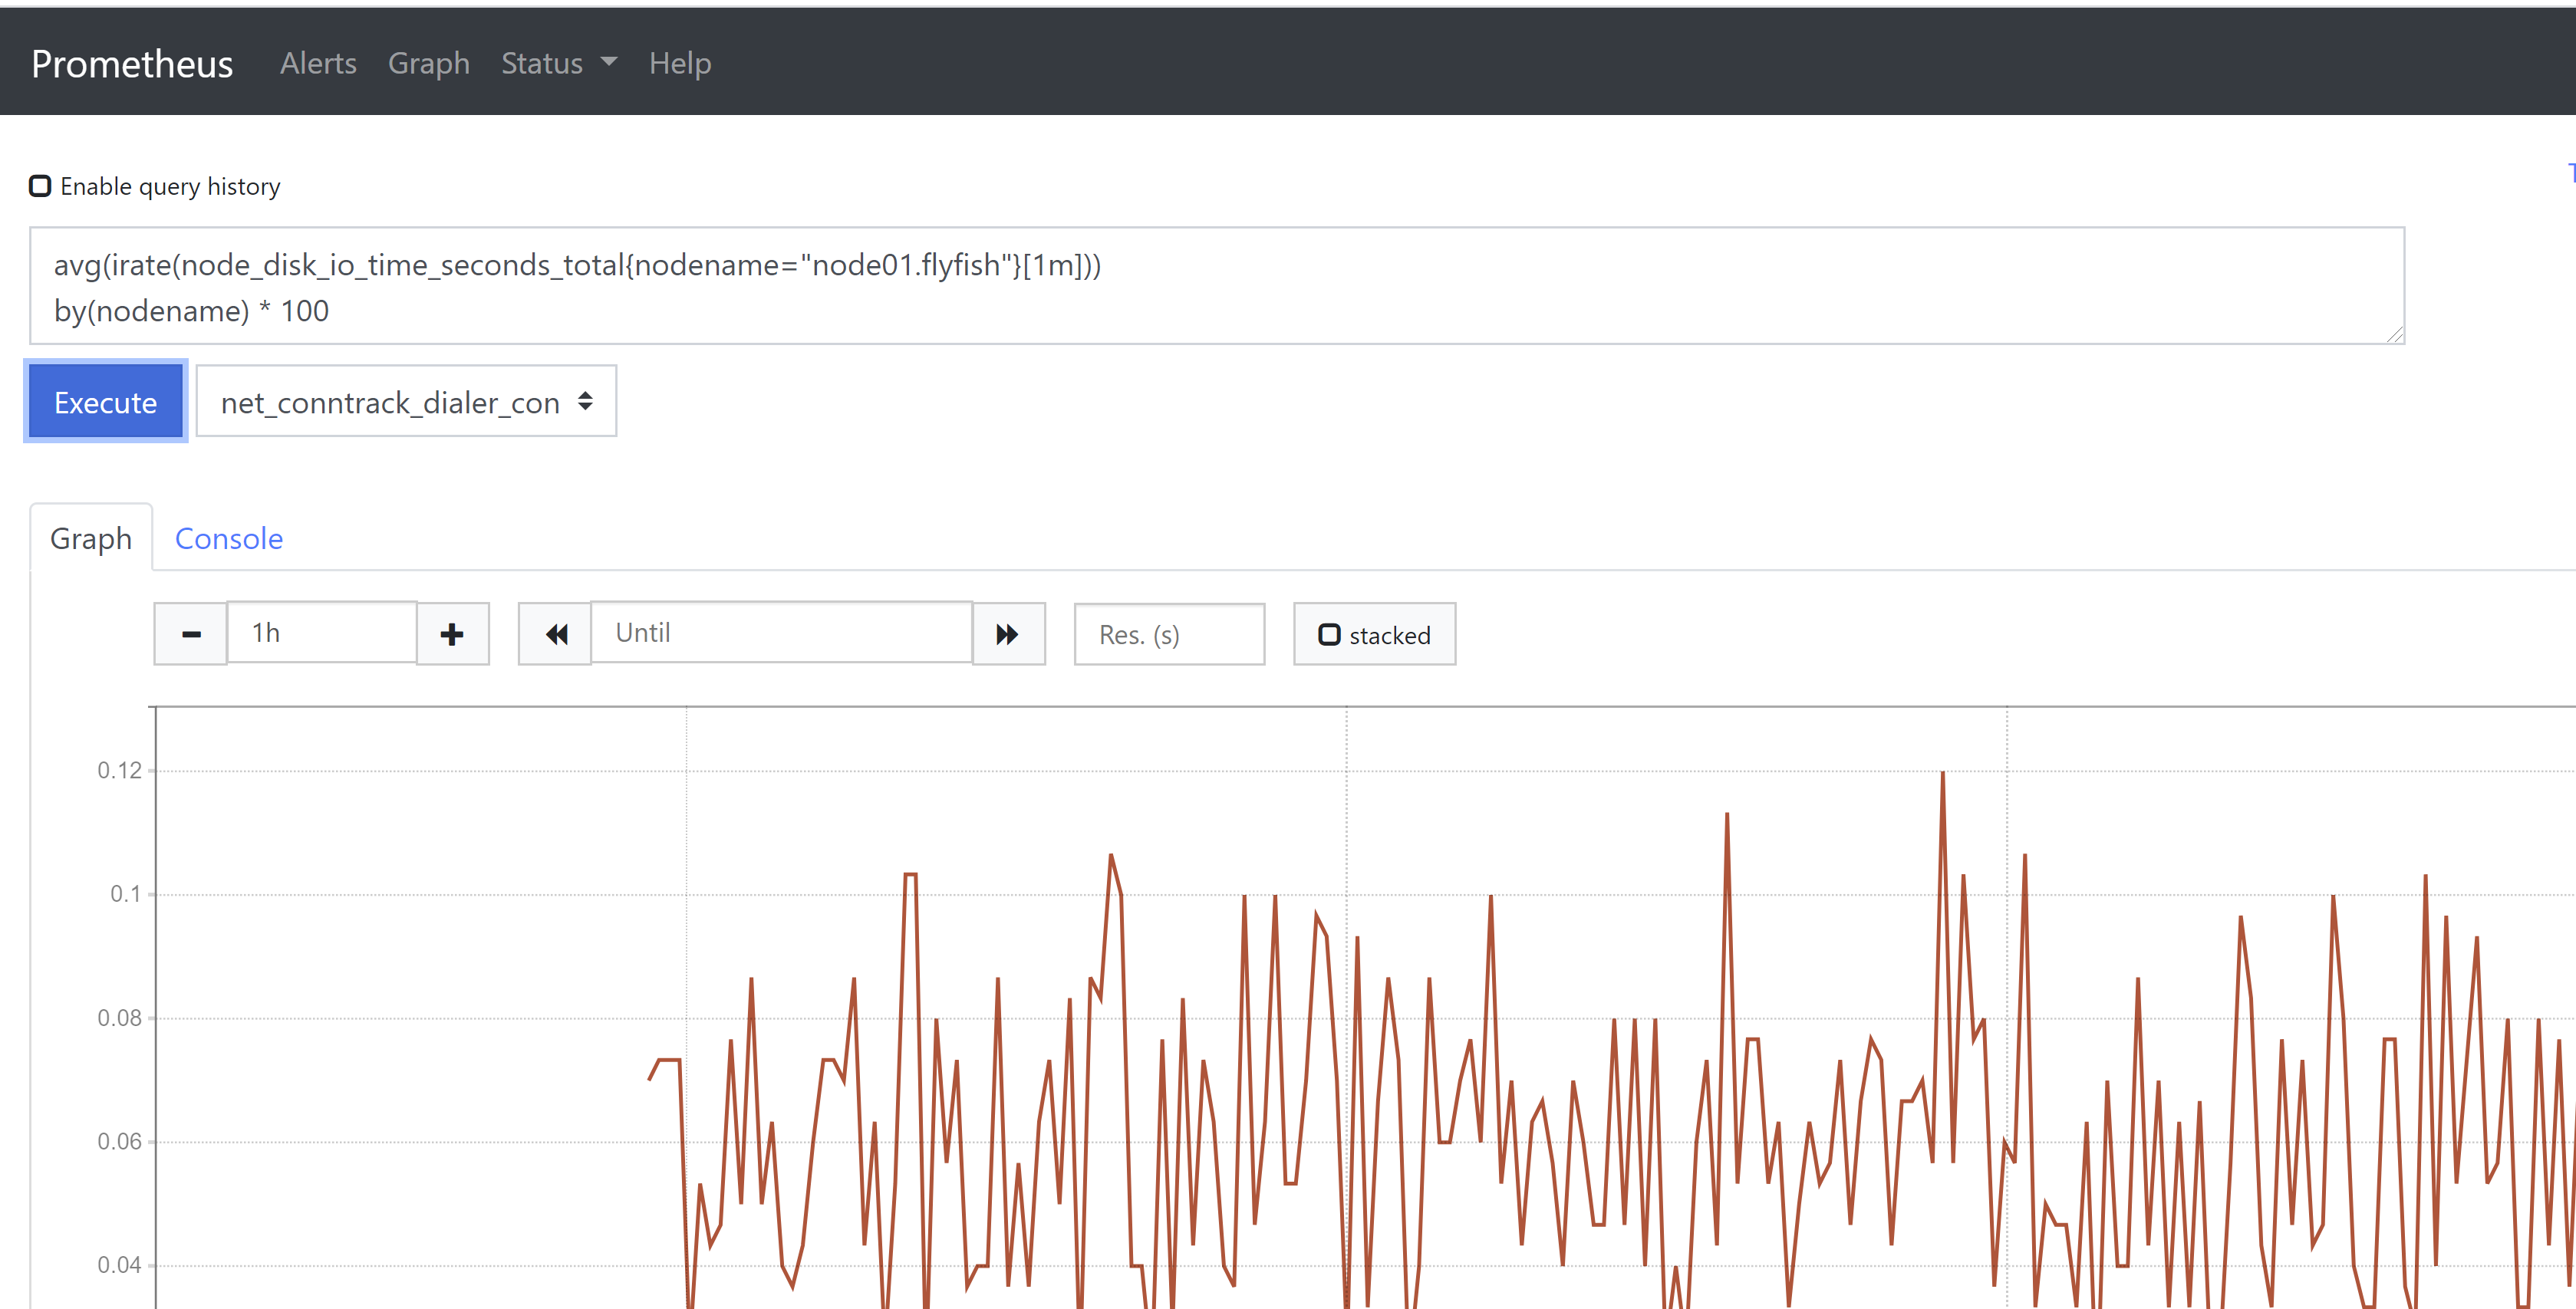
6、磁盘IO使用率avg(irate(node_disk_io_time_seconds_total{nodename="node01.flyfish"}[1m]))by(nodename) * 100
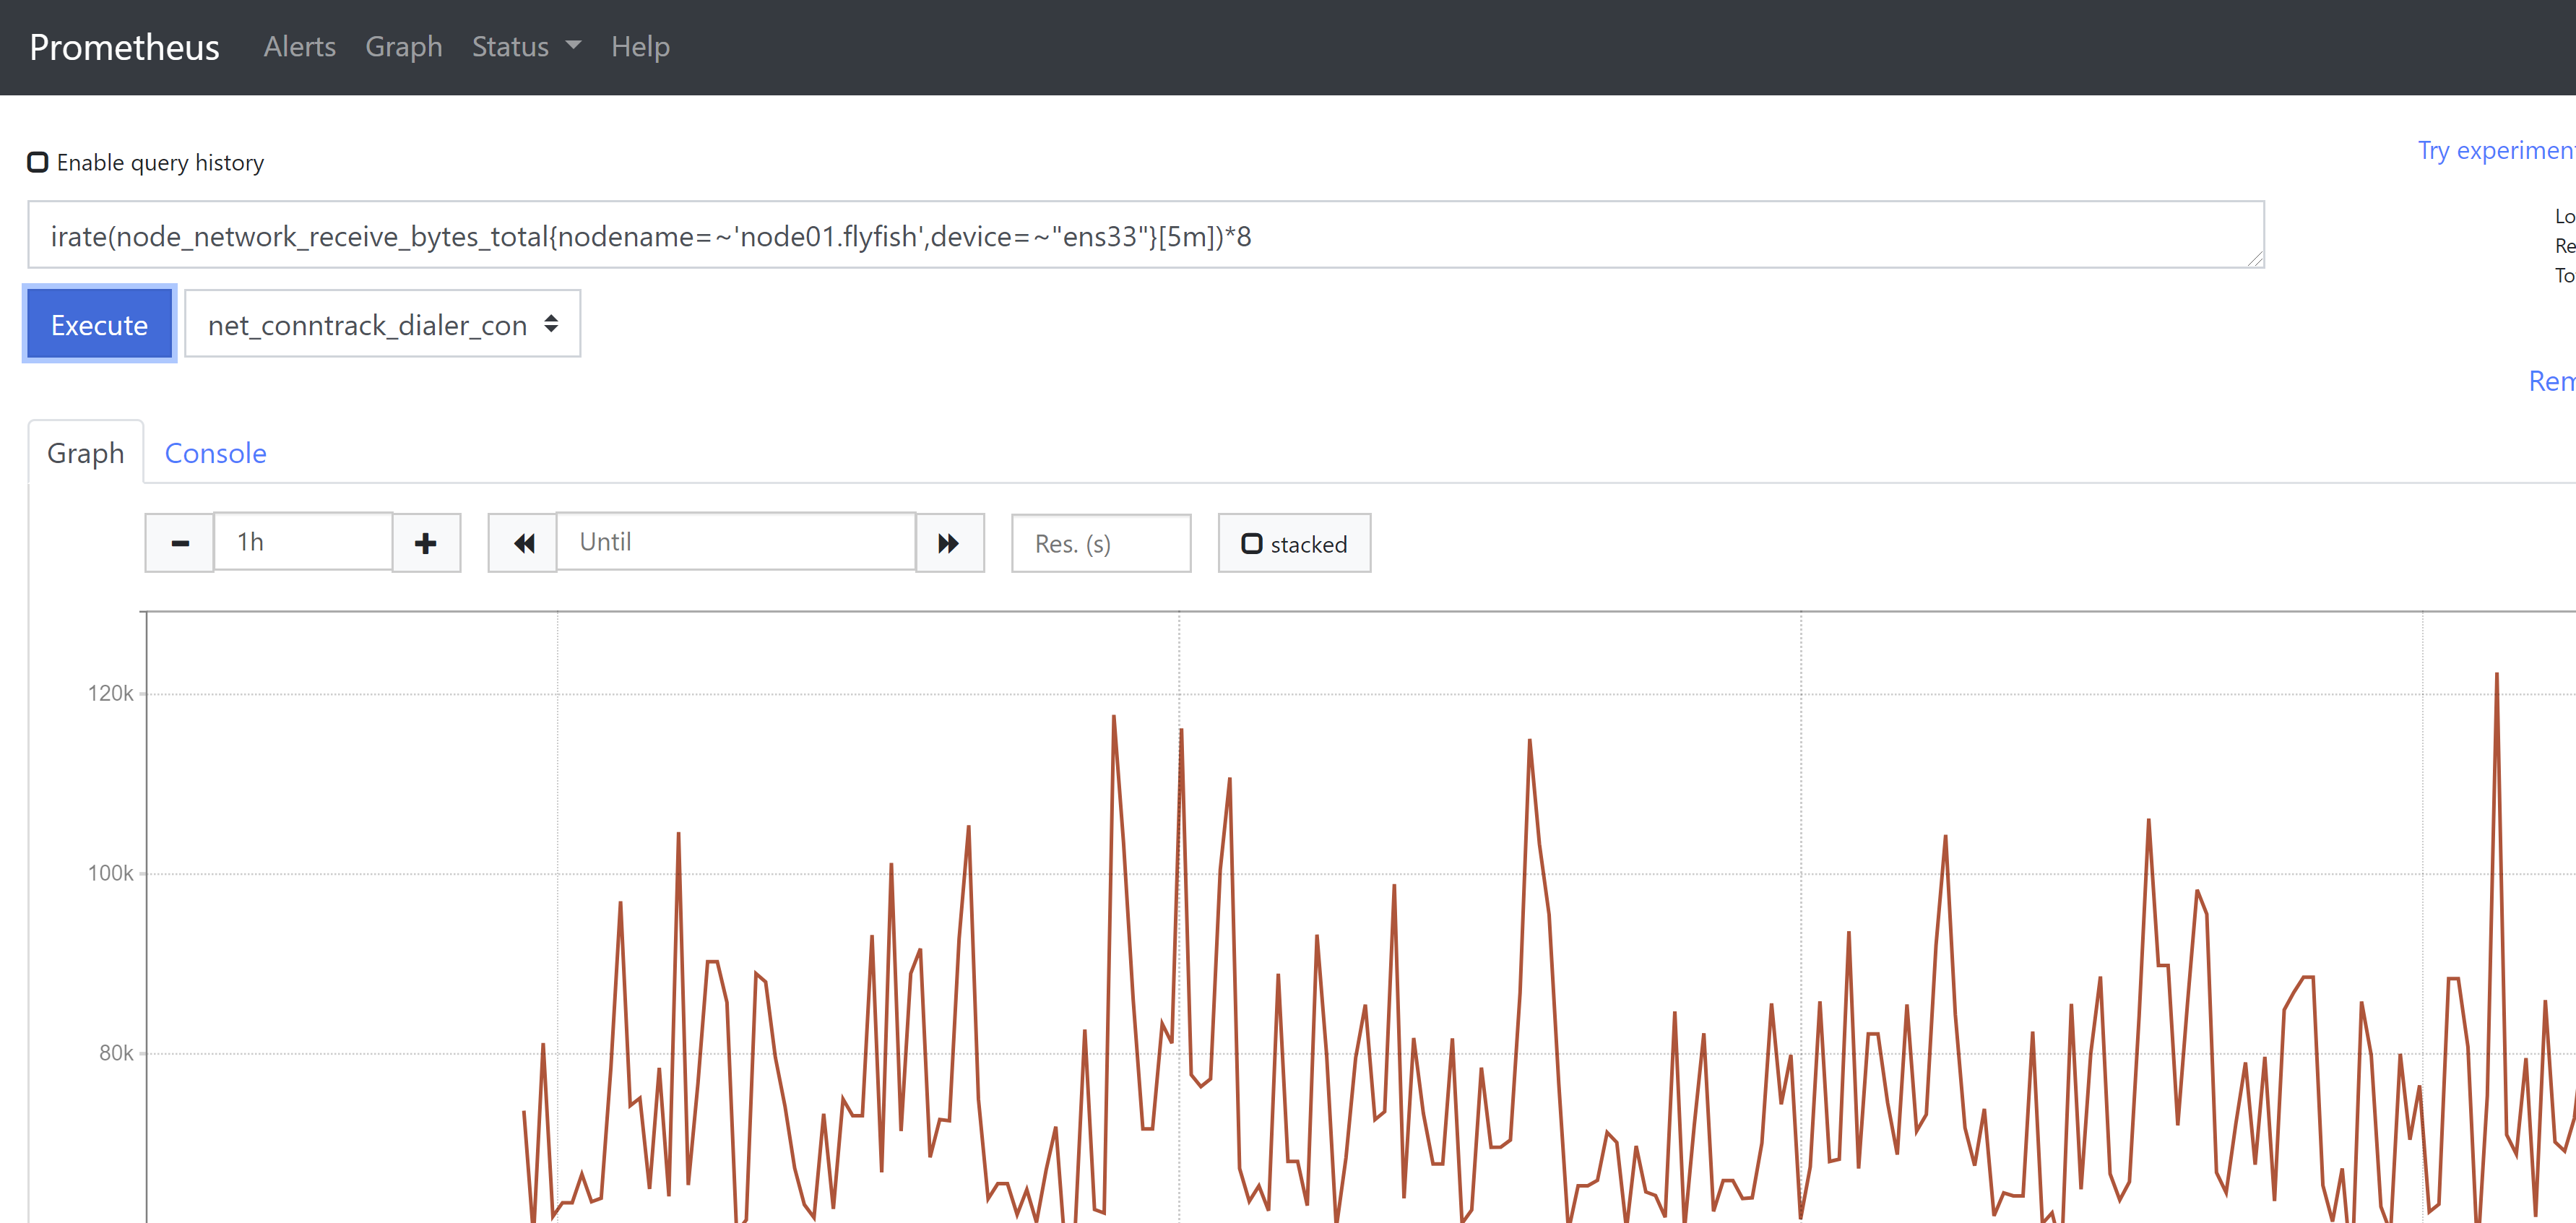
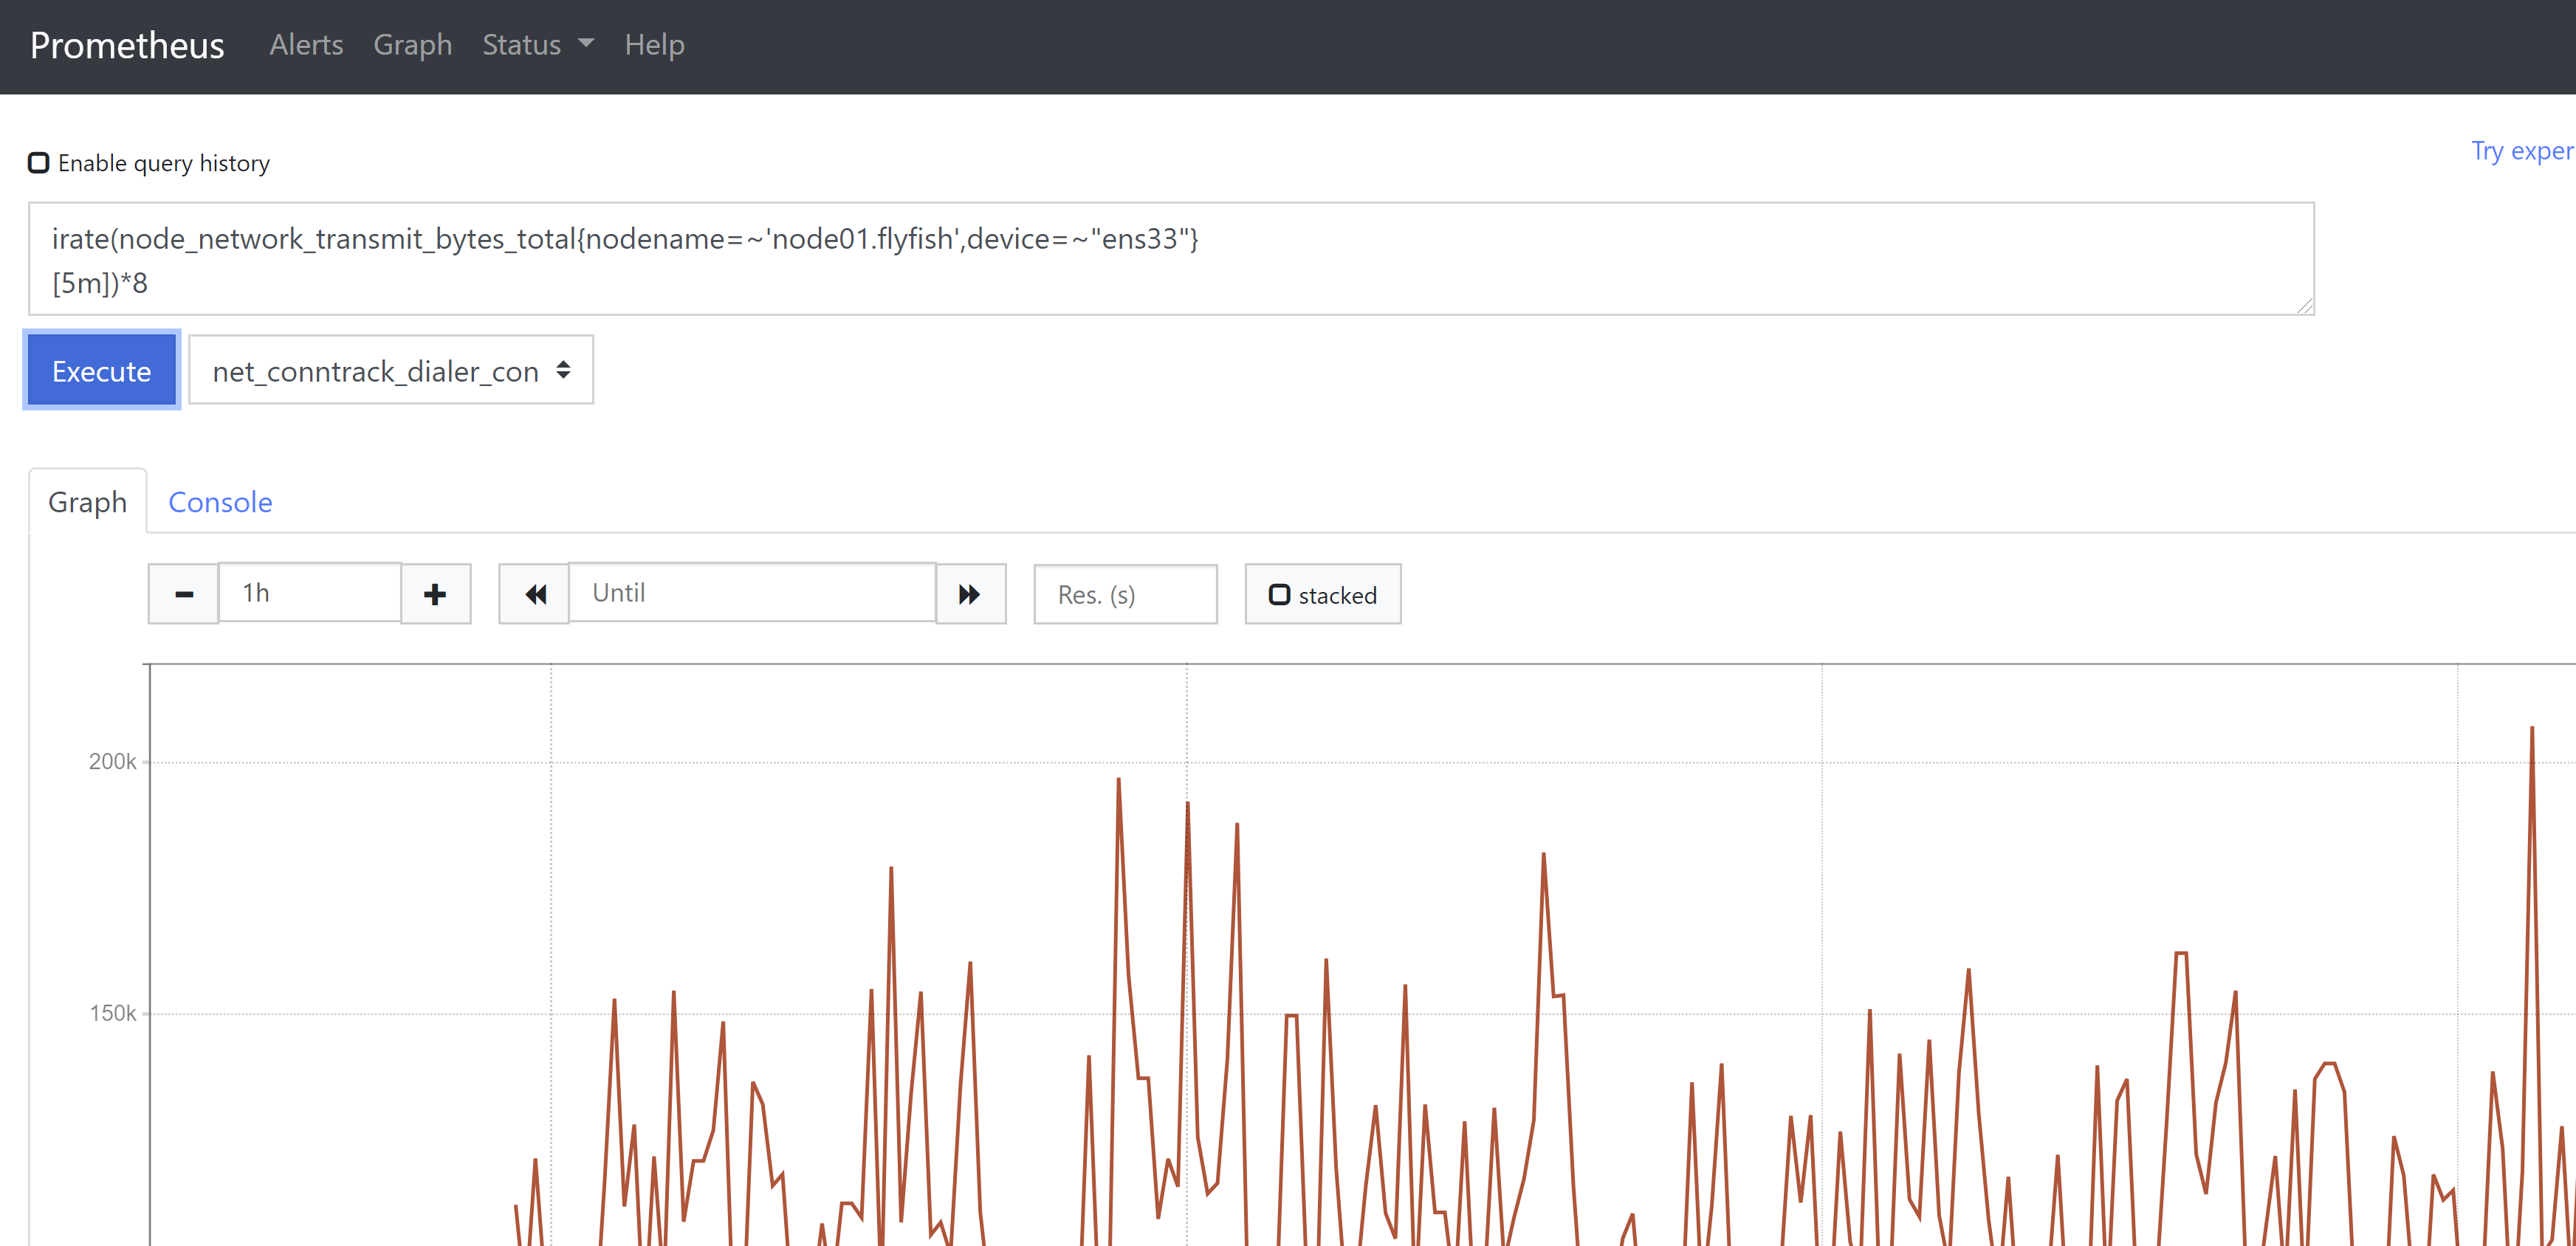
7、网卡接收/发送流量监控irate(node_network_receive_bytes_total{nodename=~'node01.flyfish',device=~"ens33"}[5m])*8irate(node_network_transmit_bytes_total{nodename=~'node01.flyfish',device=~"ens33"}[5m])*8increase()函数,获取区间向量中的第一个和最后一个样本并返回其增长量。如果除以[区间]时间(秒)就可以获取该时间内的平均增长率与rate函数用途相同(注意是rate()不是irate),如下两个图所示。
总结:在使用Prometheus来监控各种系统指标时,要熟悉并记住对应的metric name以及该metric name对应是何种数据类型,然后就是熟悉PromQL的各种函数使用。系统资源饱和度是对使用率的一个补充,能让管理者做出有关系统的最佳决策
