@zy-0815
2016-12-18T16:52:35.000000Z
字数 2518
阅读 1561
计算物理第十三次作业Problem6.9
摘要
在上一次作业中主要研究了通过Gauss-Sideal Method来求解拉普拉斯方程,这次作业主要学习如何求解波动方程。
背景
由书可知,波动的运动方程为:
最终通过求解可得
对于一端固定,一端自由的弦其自由端位移表达式有所改动,为:
其中M为最右端质点位置的计数值。
正文
程序为:
import numpy as npimport pylab as plimport mathclass wave:def __init__(self,L=1,c=300,dx=0.001,T=0.1,x0=0.05,X0=0.4):self.L=Lself.c=cself.dx=dxself.dt=dx/cself.T=Tself.t=[0]self.y1=[]self.y2=[]self.y3=[]self.y0=[]self.x0=x0self.X0=X0for i in range(1001):self.y0.append(math.exp(-1000*pow((0.001*i-self.X0),2)))self.y0[0]=0self.y=[]self.Y=[self.y0]def propagate(self):self.y1=self.y2=self.y0self.y.append(self.y2[int(self.x0/0.001)])while self.t[-1]<self.T:self.t.append(self.t[-1]+self.dt)self.y3.append(0)for i in range(999):self.y3.append(-self.y1[i+1]+self.y2[i+2]+self.y2[i])self.y3.append(self.y2[1000]+self.y2[999]-self.y1[1000])self.y.append(self.y3[int(self.x0/0.001)])self.y1=self.y2self.y2=self.y3self.y3=[]for i in range(10):if len(self.t)==i*100:self.Y.append(self.y2)a=wave()a.propagate()P=(abs(np.fft.rfft(a.y)))**2frequency=np.linspace(0, a.c/(a.dx*2), len(P))pl.plot(frequency,P)pl.xlim(0,5000)pl.xlabel("frequency")pl.ylabel("power")pl.show()pl.plot(frequency,P)pl.xlim(0,3000)pl.xlabel("frequency")pl.ylabel("power")pl.show()x=[]for i in range(1001):x.append(i*0.001)for i in range(len(a.Y)):pl.plot(x,a.Y[i])pl.ylim(-1,1)pl.xlabel("x/m")pl.ylabel("y/m")pl.show()
运行结果为:
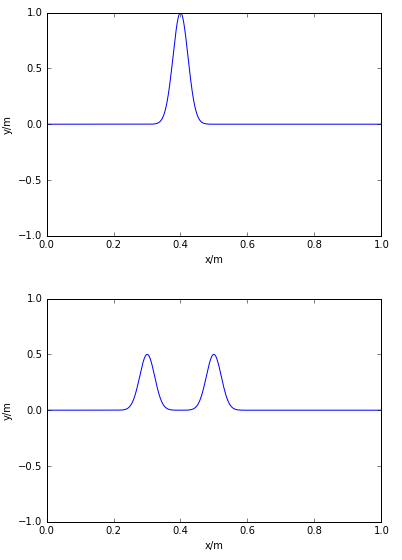
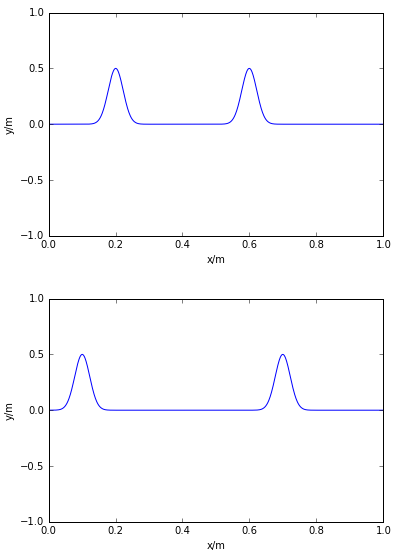
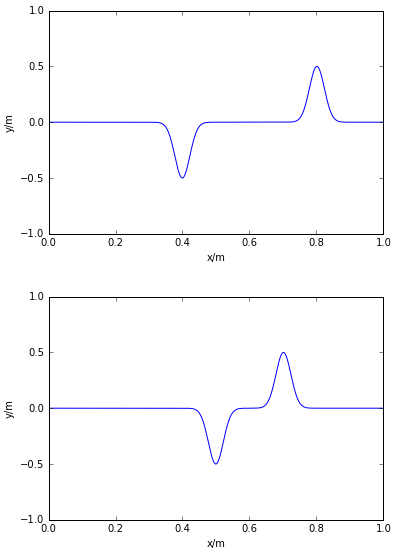
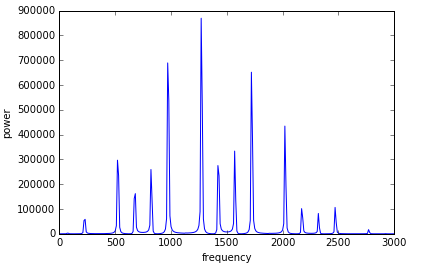
频谱图为:
对于两端固定的弦,有程序:
import numpy as npimport pylab as plimport mathclass wave:def __init__(self,L=1,c=300,dx=0.001,T=0.04,x0=0.05,X0=0.4):self.L=Lself.c=cself.dx=dxself.dt=dx/cself.T=Tself.t=[0]self.y1=[]self.y2=[]self.y3=[]self.y0=[]self.x0=x0self.X0=X0for i in range(1001):self.y0.append(math.exp(-1000*pow((0.001*i-self.X0),2)))self.y0[0]=0self.y=[]self.Y=[self.y0]def propagate(self):self.y1=self.y2=self.y0self.y.append(self.y2[int(self.x0/0.001)])while self.t[-1]<self.T:self.t.append(self.t[-1]+self.dt)self.y3.append(0)for i in range(999):self.y3.append(-self.y1[i+1]+self.y2[i+2]+self.y2[i])self.y3.append(0)self.y.append(self.y3[int(self.x0/0.001)])self.y1=self.y2self.y2=self.y3self.y3=[]for i in range(10):if len(self.t)==i*100:self.Y.append(self.y2)a=wave()a.propagate()P=(abs(np.fft.rfft(a.y)))**2frequency=np.linspace(0,a.c/(a.dx*2),len(P))pl.plot(frequency,P)pl.xlim(0,3000)pl.xlabel("frequency")pl.ylabel("power")pl.show()
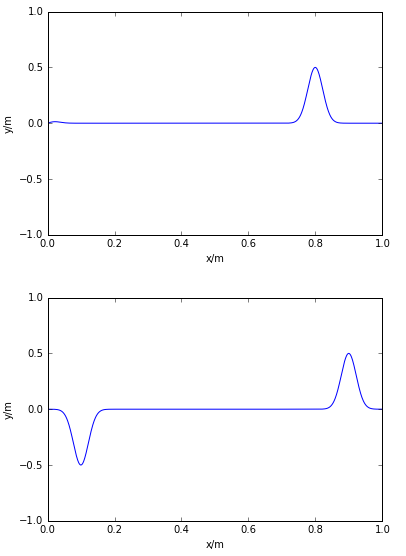
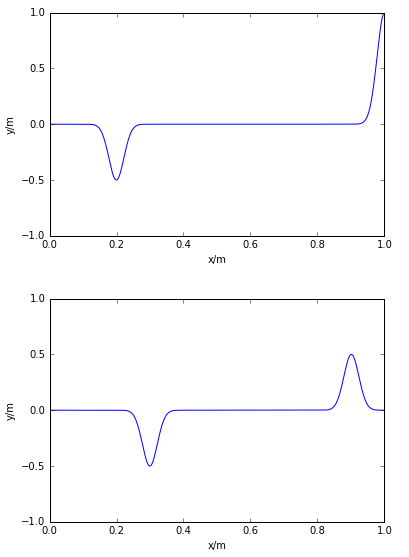
运行结果为:
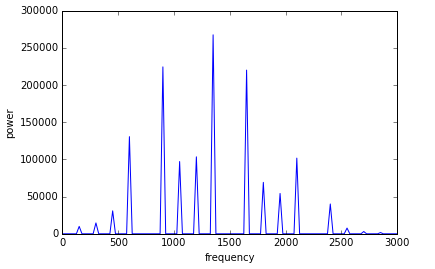
结论
通过运行程序,可以发现一端自由一端固定的弦其频谱图与两端固定的弦的频谱图不同。
致谢
齐诚同学的耐心帮助。
