@w460461339
2020-03-03T14:38:31.000000Z
字数 2405
阅读 1920
PR曲线,threshold取值
MachineLearning
1、任务描述
针对y-x1,y-x2,y-x3绘制出各自的PR曲线,描述thresh的取值与recall和precision的关系。
pr曲线:https://zhuanlan.zhihu.com/p/64963796
召回率(recall)是指分类正确的正样本个数占真正的正样本个数的比例。
精确率(precession)是指分类正确的正样本个数占分类器判定为正样本的样本个数的比例。
2、处理逻辑
针对每一个x-y,取x的最大值和最小值x_max,x_min,均分为k份,作为threshold;
计算不同threshold下的recall和precision。
例子:
x=[0,10,50,100]
y=[0,1,0,1]
那么当k=20,
threshold从小到大依次取0,5,10,20....100
3、结果分析
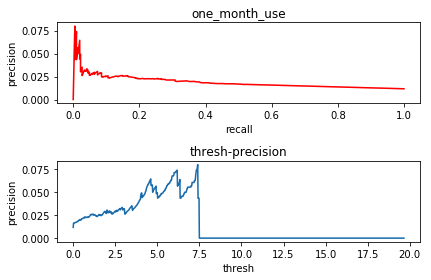
- 1)one_month_use和Y
when thresh is 7.397827973236908,precision reach maximum which is 0.08
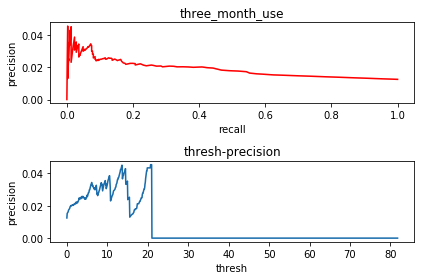
- 2) three_month_use和Y
when thresh is 20.706492755267472,precision reach maximum which is 0.045454545454545456
- 3)six_month_use和Y
when thresh is 35.82488036131835,precision reach maximum which is 0.038461538461538464
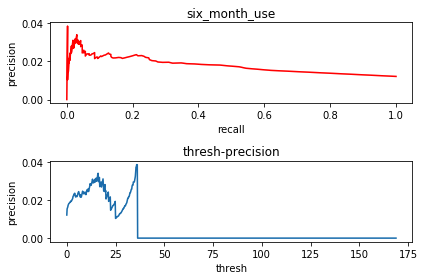
从结果上看,这几列都没有很好的效果,最好的一个属性(one_month_use)在threshold取最优的情况下,准确率也只有8%。
另外,我们发现每种情况均有一个准确率急速下降的情况,我们可以认为:
1、我们的thresh的间隔还是取得太大了。
2、thresh集中在某个区间,而不是分布在头尾。
比如:
1、有100条数据,x取值范围在0~10,有50条数据x>5;50条数据x<5。
2、在x∈5.1到5.4的区间,有10条y=1,
3、另外在x<5的区间内,有2条y=1,
4、那么按照1的间隔来取threshold时,threshold=5时precision取到最大值(10/50)=0.2,threshold=6及以上时,precision都是0
这样来看,个人认为正样本集中在某个小区间内,可以需要有两个thresh,floor_thresh和ceil_thresh,在这个区间内的才是正样本,否则是负样本。
附录:代码
import pandas as pdimport numpy as npimport randomimport matplotlib.pyplot as pltdf = pd.read_csv('./data.csv')def cal_precision(x,y,threshold):'''precision 在分类为正的样本中,有多少是真的是正'''# predictionfilter_y =y[x>=threshold]# ground_truthgt = np.sum(filter_y)# prcisionreturn gt/len(filter_y)def cal_recall(x,y,threshold):'''recall 在所有的正样本中,有多少被分对了'''# predictionfilter_y =sum(y[x>=threshold])# total_gttotal_gt = sum(y)return filter_y/total_gtdef show_prline(col_name,thresh_grid=1000):one_month_use_df = df.dropna(subset=[col_name])one_month_y = one_month_use_df.yone_month_x = one_month_use_df[col_name]one_x = np.asarray(one_month_x,dtype=np.float32)one_y = np.asarray(one_month_y,dtype=np.int8)min_x,max_x = np.min(one_x),np.max(one_x)recall_list = []precision_list = []thresh_list = np.linspace(min_x,max_x,thresh_grid)for temp_thresh in thresh_list:recall_list.append(cal_recall(one_x,one_y,temp_thresh))precision_list.append(cal_precision(one_x,one_y,temp_thresh))print('when thresh is {},precision reach maximum which is {}'.format(thresh_list[np.argmax(precision_list)],np.max(precision_list)))plt.subplot(211)plt.title(col_name)plt.xlabel('recall')plt.ylabel('precision')plt.plot(recall_list,precision_list,'r')plt.tight_layout()plt.subplot(212)plt.title('thresh-precision')plt.xlabel('thresh')plt.ylabel('precision')plt.plot(np.linspace(min_x,max_x,1000),precision_list)plt.tight_layout()plt.show()
