@zsh-o
2018-07-19T13:23:30.000000Z
字数 5447
阅读 1953
7 - SVM-SMO —— 代码
《统计学习方法》
只有代码和执行可视化结果,原理请移步另一篇:SVM - 原理
%matplotlib inlineimport numpy as npfrom matplotlib import pyplot as pltepsilon = 1e-8
class SVM(object):def linear_kernel(self, x, y, b=1.):return x @ y.T + bdef rbf_kernel(self, x, y, sigma=1.):if np.ndim(x) == 1 and np.ndim(y) == 1:return np.exp(- np.linalg.norm(x - y) / (2 * sigma **2))elif np.ndim(x) > 1 and np.ndim(y) > 1:return np.exp(- np.linalg.norm(x[:, np.newaxis] - y[np.newaxis, :], axis=2) / (2 * sigma **2))else:return np.exp(- np.linalg.norm(x - y, axis=1) / (2 * sigma ** 2))def __init__(self, C=1.0, tol=1e-3, eps=1e-3, kernel_func='rbf'):self.C = Cself.tol = tolself.eps = epsself.b = 0.if kernel_func is 'linear':self.kernel_func = self.linear_kernelelif kernel_func is 'rbf':self.kernel_func = self.rbf_kernelelse:if callable(kernel_func) is True:self.kernel_func = kernel_funcelse:print('Error kernel function')def objective_function(self, alphas):calpha = alphas[:, np.newaxis]cY = self.Y[:, np.newaxis]return 0.5 * np.sum(calpha * calpha.T * cY * cY.T * self.K) - np.sum(alphas)def decision_function(self, x_test):k = self.kernel_func(self.X, x_test)return self.alpha * self.Y @ k + self.bdef update_E(self):self.E = self.alpha * self.Y @ self.K + self.b - self.Ydef step(self, i, j):if i == j:return 0alpha1, alpha2 = self.alpha[[i, j]] # old alpha1, old alpha2y1, y2 = self.Y[[i, j]]E1, E2 = self.E[[i, j]]s = y1 * y2K11, K12, K22 = self.K[i, i], self.K[i, j], self.K[j, j]eta = K11 + K22 - 2 * K12 ## 非正定核会出现eta < 0,K(x,y) = <phi(x),phi(y)>b = self.b # old bif y1 == y2:L = max(0, alpha2 + alpha1 - self.C)H = min(self.C, alpha2 + alpha1)else:L = max(0, alpha2 - alpha1)H = min(self.C, alpha2 - alpha1 + self.C)if L == H:return 0if eta > 0:a2 = alpha2 + y2 * (E1 - E2) / etaa2 = min(a2, H)a2 = max(a2, L)else:alpha_adj = self.alpha.copy()alpha_adj[j] = LLobj = self.objective_function(alpha_adj)alpha_adj[j] = HHobj = self.objective_function(alpha_adj)if Lobj < (Hobj - self.eps):a2 = Lelif Lobj > (Hobj + self.eps):a2 = Helse:a2 = alpha2if a2 < epsilon:a2 = 0.elif a2 > (self.C - epsilon):a2 = self.Cif np.abs(a2 - alpha2) < self.eps * (a2 + alpha2 + self.eps): # ?return 0a1 = alpha1 + s * (alpha2 - a2)b1 = y1 * K11 * (alpha1 - a1) + y2 * K12 * (alpha2 - a2) - E1 + bb2 = y1 * K12 * (alpha1 - a1) + y2 * K22 * (alpha2 - a2) - E2 + bif a1 > 0 and a1 < self.C:b_new = b1elif a2 > 0 and a2 < self.C:b_new = b2else:b_new = (b1 + b2) * 0.5self.b = b_newself.alpha[i] = a1self.alpha[j] = a2self.update_E()return 1def examineExample(self, j):alpha2 = self.alpha[j]E2 = self.E[j]y2 = self.Y[j]r = E2 * y2 # y_i * f_i - 1if (r < -self.tol and alpha2 < self.C) or (r > self.tol and alpha2 > 0): ## 检验tol-KKT条件,tol指KKT条件的精度if len(self.alpha[(self.alpha!=0) & (self.alpha != self.C)]) > 1: ## 为什么要保证边界上的点大于1个?才选择最优的alpha2,一般来说更改边界上的点才会使得值最大,毕竟边界上的点对最终优化结果影响最大# delta_E = np.abs(E2 - self.E)delta_E = np.abs((E2 - self.E) / self.K[j, :]) ##i = np.argmax(delta_E)if self.step(i, j):return 1for i in np.roll(np.where((self.alpha != 0) & (self.alpha != self.C))[0],np.random.choice(np.arange(self.N))):if self.step(i, j):return 1for i in np.roll(np.arange(self.N), np.random.choice(np.arange(self.N))):if self.step(i, j):return 1return 0def fit(self, X,Y):self.X, self.Y = X, Yself.N, self.M = X.shapeself.alpha = np.zeros(self.N)self.K = self.kernel_func(X, X)self.update_E()numChanged = 0examineAll = Truewhile numChanged > 0 or examineAll:numChanged = 0if examineAll is True:for j in range(self.N):numChanged += self.examineExample(j)else:for j in np.where((self.alpha != 0) & (self.alpha != self.C))[0]:numChanged += self.examineExample(j)if examineAll is True:examineAll = Falseelif numChanged == 0:examineAll = Truedef predict(self, Xs):return np.sign(self.decision_function(Xs))
from sklearn.datasets import make_moonsfrom sklearn.datasets import make_circlesfrom sklearn.preprocessing import StandardScaler
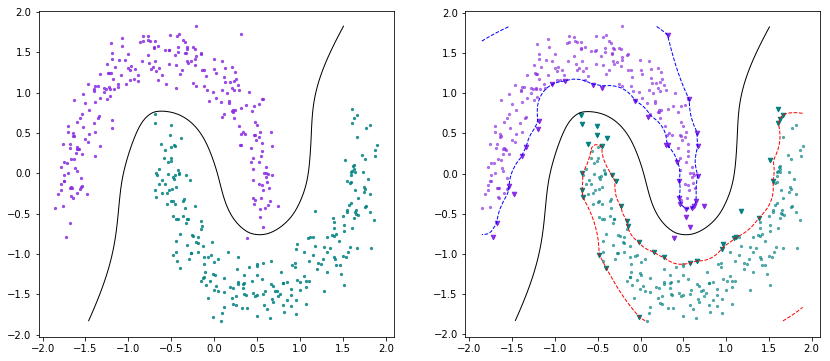
X, Y = make_moons(n_samples=500, shuffle=True, noise=0.1)scaler = StandardScaler()X = scaler.fit_transform(X)Y[Y==0] = -1
svm = SVM(C=1)svm.fit(X, Y)
def plot_decision_boundary(model, resolution=100, colors=('b', 'k', 'r'), figsize=(14,6)):plt.figure(figsize=figsize)xrange = np.linspace(model.X[:,0].min(), model.X[:,0].max(), resolution)yrange = np.linspace(model.X[:,1].min(), model.X[:,1].max(), resolution)grid = [[model.decision_function(np.array([xr, yr])) for yr in yrange] for xr in xrange]grid = np.array(grid).reshape(len(xrange), len(yrange))# 左边plt.subplot(121)c_1_i = model.Y == -1plt.scatter(model.X[:,0][c_1_i], model.X[:,1][c_1_i], c='blueviolet', marker='.', alpha=0.8, s=20)c_2_i = np.logical_not(c_1_i)plt.scatter(model.X[:,0][c_2_i], model.X[:,1][c_2_i], c='teal', marker='.', alpha=0.8, s=20)plt.contour(xrange, yrange, grid.T, (0,), linewidths=(1,),linestyles=('-',), colors=colors[1])#右边plt.subplot(122)plt.contour(xrange, yrange, grid.T, (-1, 0, 1), linewidths=(1, 1, 1),linestyles=('--', '-', '--'), colors=colors)c_1_i = model.Y == -1plt.scatter(model.X[:,0][c_1_i], model.X[:,1][c_1_i], c='blueviolet', marker='.', alpha=0.6, s=20)c_2_i = np.logical_not(c_1_i)plt.scatter(model.X[:,0][c_2_i], model.X[:,1][c_2_i], c='teal', marker='.', alpha=0.6, s=20)mask1 = (model.alpha > epsilon) & (model.Y == -1)mask2 = (model.alpha > epsilon) & (model.Y == 1)plt.scatter(model.X[:,0][mask1], model.X[:,1][mask1],c='blueviolet', marker='v', alpha=1, s=20)plt.scatter(model.X[:,0][mask2], model.X[:,1][mask2],c='teal', marker='v', alpha=1, s=20)
plot_decision_boundary(svm)
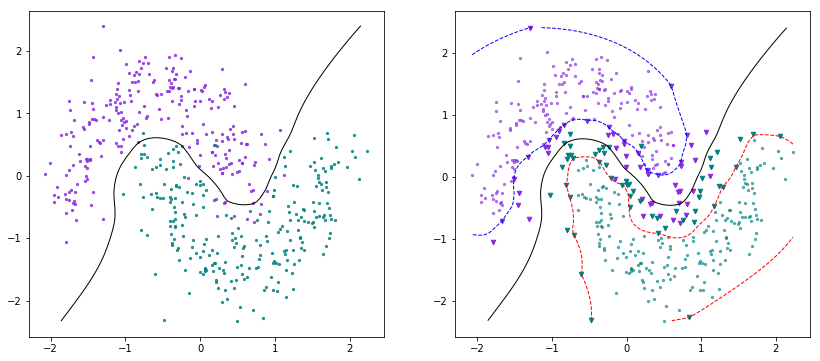
X, Y = make_moons(n_samples=500, shuffle=True, noise=0.2)scaler = StandardScaler()X = scaler.fit_transform(X)Y[Y==0] = -1
svm = SVM(C=1)svm.fit(X, Y)
plot_decision_boundary(svm)
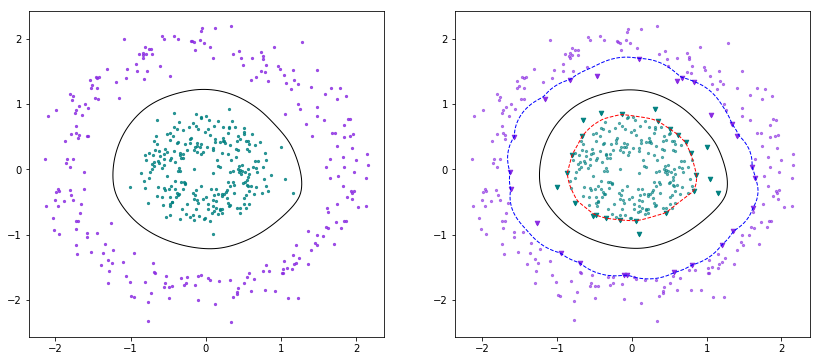
X, Y = make_circles(n_samples=500, shuffle=True, factor=0.3, noise=0.1)scaler = StandardScaler()X = scaler.fit_transform(X)Y[Y==0] = -1
svm = SVM(C=1)svm.fit(X, Y)
plot_decision_boundary(svm)
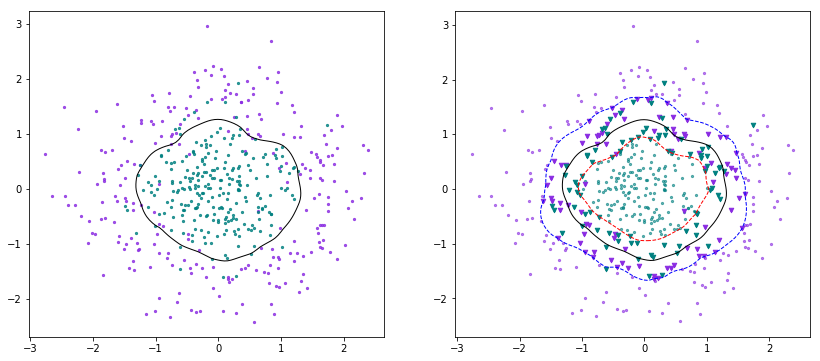
X, Y = make_circles(n_samples=500, shuffle=True, factor=0.3, noise=0.25)scaler = StandardScaler()X = scaler.fit_transform(X)Y[Y==0] = -1
svm = SVM(C=1)svm.fit(X, Y)
plot_decision_boundary(svm)
SMO的原始论文写得非常好,现有的SMO的代码基本上都是按照论文中给出的代码结构来写的
