@FangYing
2016-05-08T02:32:09.000000Z
字数 3612
阅读 1246
Chapter 3 problem 3.26
python.assignment
name: Li FangYing
number: 2013301020027
Abstract
The well-known Lorentz model will be discussed. We will concentrate on evolution of the system at different driving forces. In addition, phase space will be plotted as well as sectional views of it.
Introduction
Lorentz model was developed by the atmospheric scientist E.N.Lorentz(1963), which provided a major contribution to the modern field of chaos.
Lorentz wa studying the basic equation of fluid mechanics, which are known as the Navier-Stokes equations; they can be thought of as Newton's laws written in a form appropriate for a fluid, and they are almost impossible to be solved analytically. Lorentz considered a special situation, which known as Rayleigh-Benard problem, which concerns a fluid in a container whose top and surfaces are held at different temperatures. When temperature rise, it will undergo a transition from a stationary state to a steady flow state, than to a
chaotic flow.
Lorentz tackle this problem with a greatly simplified version of the Navier-Stokes equation:
They are now known as the famous Lorentz equations.
are derived from temperature, density ande velocity, and are measures of the temperature difference across the fluid and other parameters. Notice that the temperature difference is the driving force in fluid system.
Although this model is to simple to be applyed to any realistic sysytems, the behaviors exhibit in these equations is indicative of the type of behaviors exist in other more complicated systems.
That's why we study chaos, we can never simulate completely, but we can get to simplified versions and gain valuable insights to the problem.
Nummerical Approach
You might be surprise that Euler method can be applyed to Lorentz model, but it is actually feasible for the following reason:
If the time steps in the Euler algorithm is sufficiently small, the energy lost or added from the eerom terms of the method can became negligible compared to the energy lost or added by damping or driving force. So we will again apply Euler Method to tackle this problem.
Data analysis
The evolution of Lorentz model at different drivng forces
parameter is a measure of temperature difference between the top and bottom surface of the fluid, which plays a role similar to the drive amplitude. Let's increase r and view the evolution of the state of the fluid.
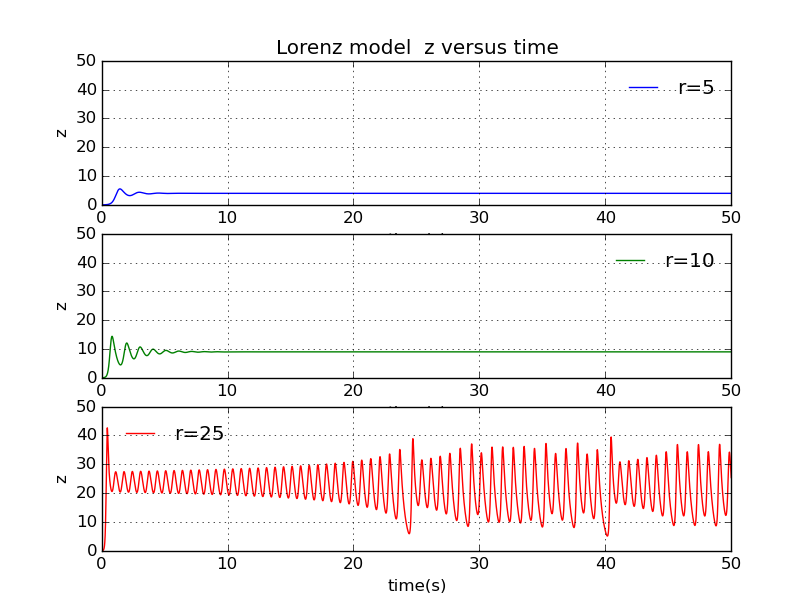
As you can see, at r=5 there is a quick decay and z becomes a constant after that. The same behavior is viewed as r=10, although the transient takes longer to decay. These two cases correspond to steady convective motion in original fluid, in which the warm fluid produced at the bottom rises and the cooler fluid at the top returns. But as r rises, which means the temperature difference becomes more and more large, the steady convection will turn to chaoic behavior, the turning point is exactly , so you can view totally different phenomenon at r=25.
The phase space plot
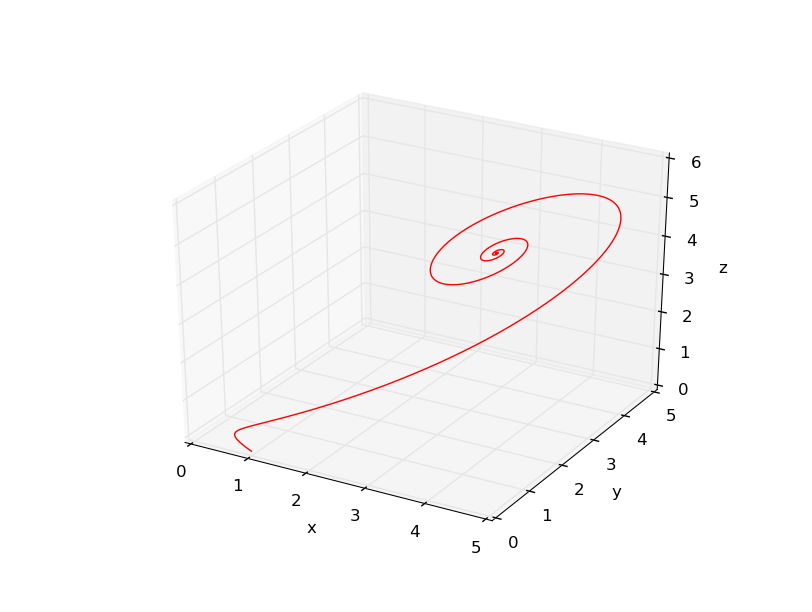
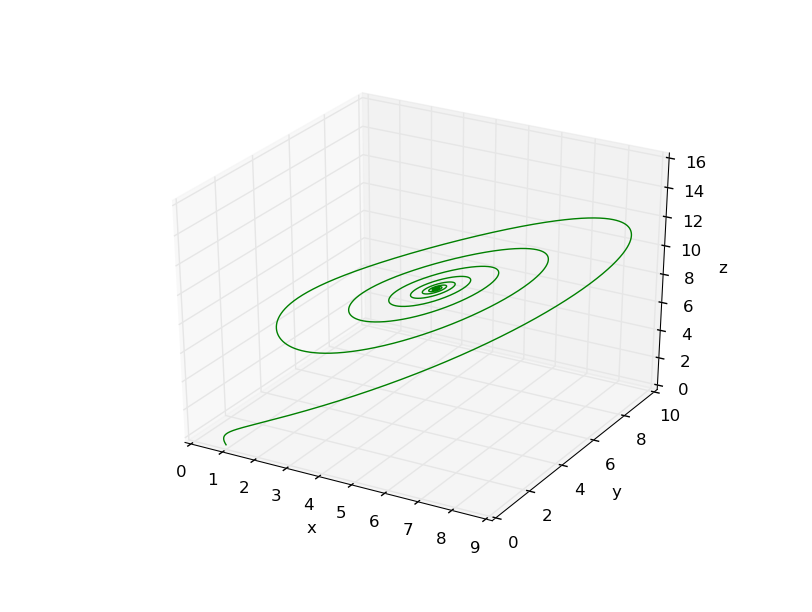
The phase space plotncan give us some hints of an underlying regularity, so I plot them as follow:
when :
when :
when :
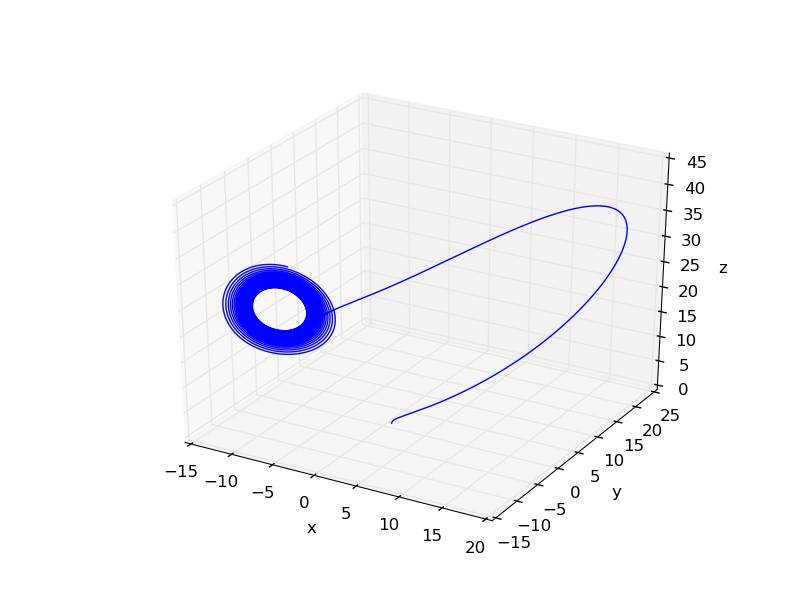
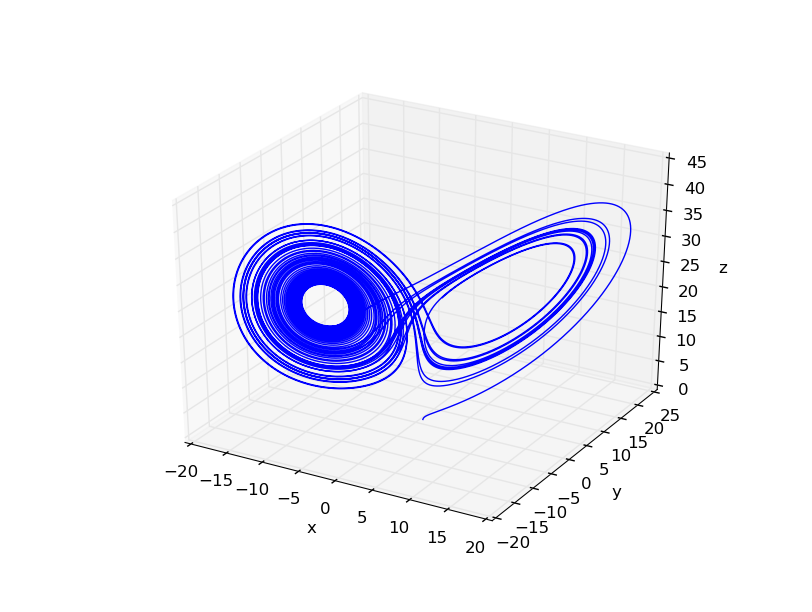
You can see when r=25 the figure appear a typical chaotic form, and the well-known Lorentz strange attractor can be seen.
What's more, we know x, y and z can be viewed as specifying the trajectory of a particle moving in three dimension, so it's natural to plot two-dimensions slices through this trajectory:
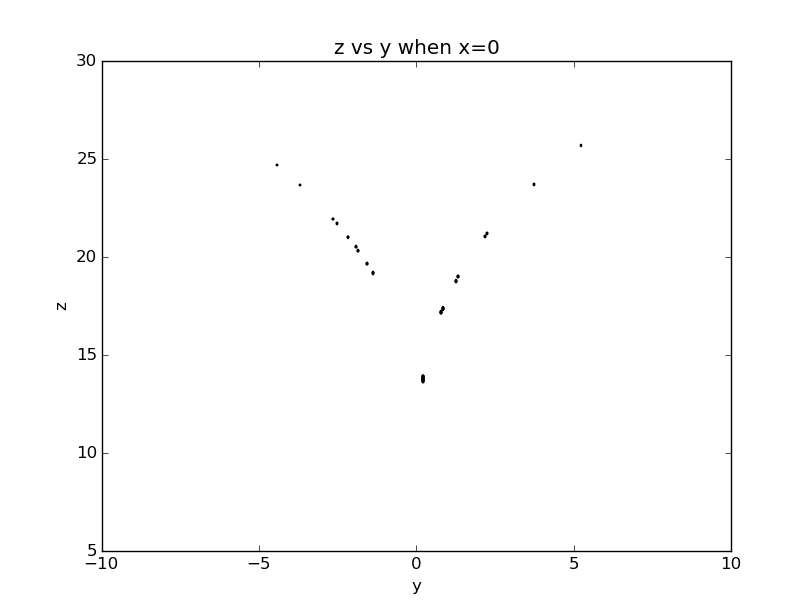
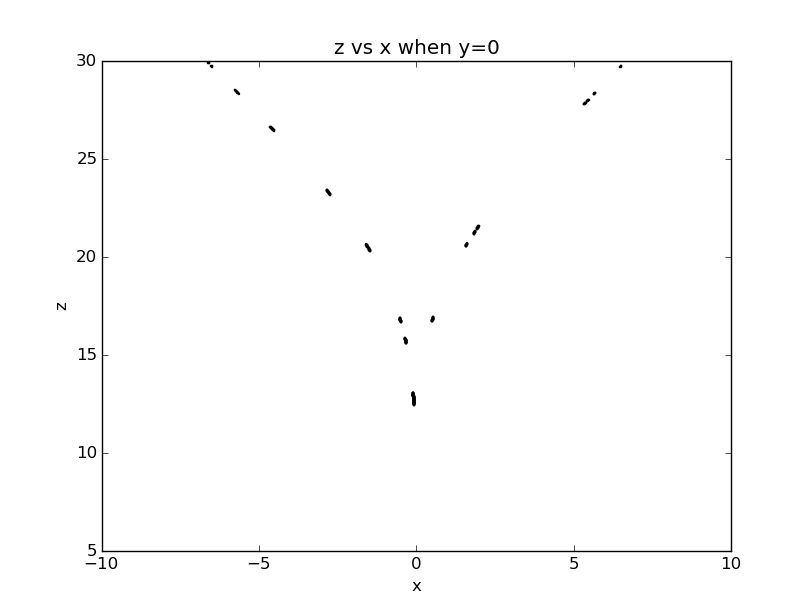
We see from the figure that even though the behavior is chaotic, there is very high level of regularity in the phase-space trajectory. This attractor surface is actually indenpendent of initial conditions, hence we can predict that the system will be found where in the phase space.
Conclusion
Euler method is applyed to Lorentz model, by which the transition from steady convection state to chaotic state is explored. The turning point is around r=25. What's more, phase space plot and its two-dimension slices are plotted, which imply the regularity under chaos. It can be used to predict the system will be found where on the attractor surface in phase space.
program codes
apology
I should apologize for last week I spend so much time on my physics test that miss the deadline of the assignment.
