@ShixingWang
2016-04-02T13:39:09.000000Z
字数 5703
阅读 1499
View this Report on 作业部落
Exercise 5: Problem 1.6 - Population Growth
Abstract
A population growth problem is investigated about the linear birth rate and a quadratic death rate. Compared with the similar problem in the previous exercise, a new program finished in an object-oriented way is presented, in which the four steps a reader-friendly program should have are presented in a natural way as four internal functions of the class. Also the 3-D plotting is practiced with the importing of visual package.
Background
Population
The population problem has been a worldwide one for quite a long time while it casts various chanllenges to different regions in the world. In highly developed countries, the negative growth rate has cause heavy pressure for employment and policies for migrations, while in the third world where the major of the increase of population happens, the increased population neutralized the growth of gross domestic products. At present there are approximately 7.312 billion people in the world, based on the estimation of the United States Census Bureau.[1] And according to the National Bureau of Statistics of People's Republic of China, there are about 1.37 billion people in China.[2] This country is confronted with the problem of both a large number and a rapid decrease of new-born population due to the "family plan". And a recent legislation has loosen the policy of population control.
As for the mathematical description the population evolution over time, there have been various models. The most famous one must be the one raised by Lord Thomas Robert Malthus that the population experiences a geometrical growth, leading to the conflict with the arithmatic growth of means of livelihood, known as the Malthus Catastrophe.[3] The modern population model is the Leslie model based on the linear algebra. The population of various ages at a certain time can be described with a vector, and the population evolution can be calculated from the product of Leslei matrix and the initial vector.[4]
Object Oriented Programming
Object-oriented programming is a program paradigm where the concept "class" is emphasized. [1] A class is an abstract of several objects sharing the same characteristics and behaviors. Programmers could define new classes which inherit from the former classes, possesing the same characeteristics. This provides programming with more flexibility and expansibility. Once a class is finished, it can be treated as a "black box", releasing the pressure for sustaining.
In Python it can be treated as a data type. It is only required in this course to master the definition and single inheritance of the class.
VPython
VPython is a python module used for the 3-D display and animation.[2] The package can be used if you import visual at the front of the program. The download and install is a little troublesome for the Internet connection problems. For Windoes and Anaconda environment, the command
conda intall -c https://conda.binstar.org/mwcraig vpython
is always hindered with error report. You can download the package from the official link for the official Pyhton platform, but I have tested and it is okay to install this on Anaconda environment.
Pickle
Storing results is a critical step in a physics computation. Although this was emphasized in the previous exercise report, it was not presented in the codes for the lack of knowledge about the pickle module. [3] The pickle module is one that can "create portable serialized representations of Python objects". [4] More information can be found on IPython when you input import pickle and pickle?. With this we can output the data we get into a file and reload later.
Programs
Object-Oriented
To practise the object-oriented paradigm we include the main body of the program into the class population_growth, in which there are four parts __init__(), calculate(), plot2D(), plot3D(), cooresponding to the initialization of variables and parameters, calculation, and restoring and representing of results.
The code is uploaded to Github.
Comparasion with Analytical Solution
For a first-order ordinary differential equation with the form in the problem
and the solution can be figured out through the method of elementary integrals and the solution is
We can add a function in the class population_growth and plot the analytical solution altogether with the numerical solutions. Here we choose several time step length and show them with the analytical solutions.

Limit Behavior
From the analytical solution above we find an interesting fact that the final steady state is determined only by the ratio of the birth and death rate, independent from the initial number.
So by adjusting the parameters we can have three different behavior of the system: increase, decrease, unchange.

Time Needed to Stablize
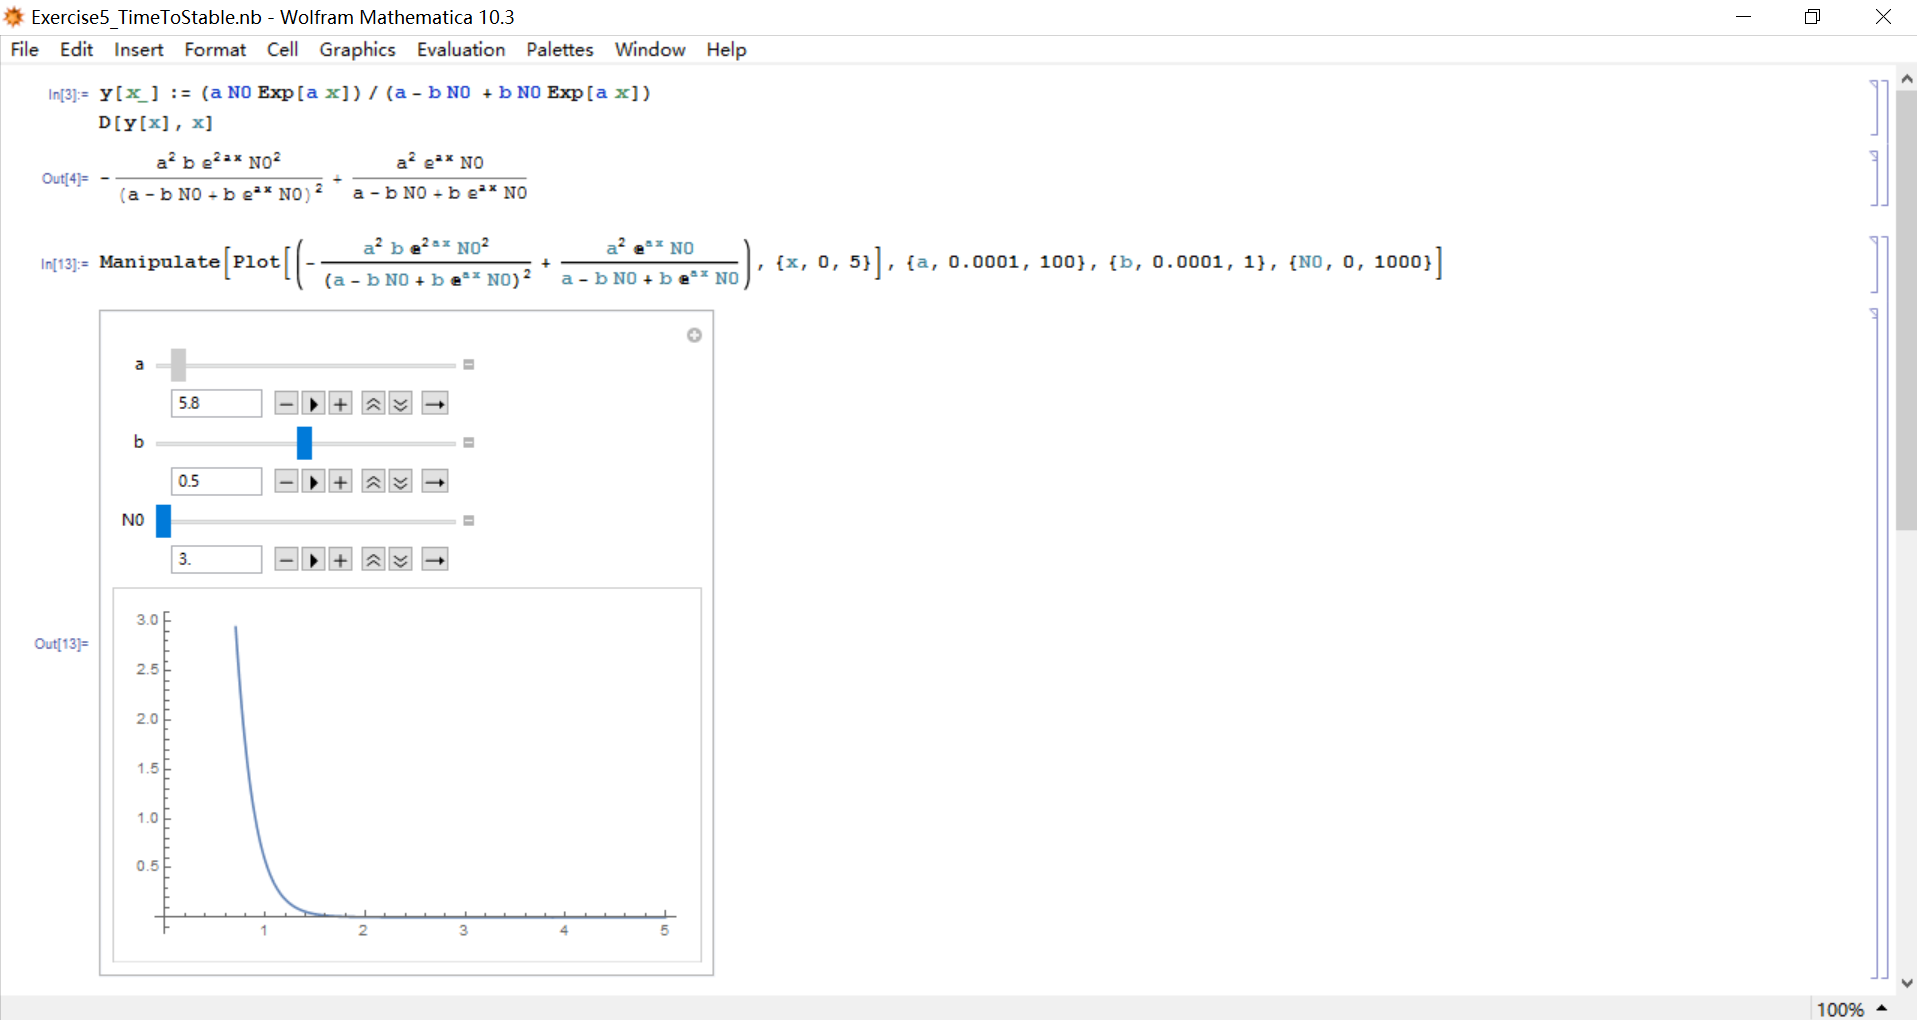
By calculating the derivative versus time
As we can see, this is tightly related with the choice of parameters. And here is a Mathematica project in which you can manipulate the parameters and see its behavior.
Acknowledgement
I must appreciate Prof. Cai for the usage of pickle and visual. That part of the program are cloned from the sample codes on Prof. Cai's Repository.
Reference
- [1] Wikipedia contributors. "Population. " Wikipedia, The Free Encyclopedia. Wikipedia, The Free Encyclopedia, 26 Mar. 2016. Web. 28 Mar. 2016.
- [2] The official page of National Bureau of Statistics of People's Republic of China, at http://www.stats.gov.cn/
- [3] Wikipedia contributors. "Thomas Robert Malthus." Wikipedia, The Free Encyclopedia. Wikipedia, The Free Encyclopedia, 9 Mar. 2016. Web. 28 Mar. 2016.
- [4] Ju, Yuma. Linear Algebra. Tsinghua University Press, September, 2002.
- [5] Wikipedia contributors. "Object-oriented programming." Wikipedia, The Free Encyclopedia. Wikipedia, The Free Encyclopedia, 25 Mar. 2016. Web. 27 Mar. 2016.
- [6] VPython, 3D Programming for Ordinary Mortals. http://www.vpython.org/, March 27, 2016.
- [7] Shixing Wang. Exercise 4: Problem 1.5 - Double Decay. https://Github/ShixingWang/computationalphysics_N2013301020050/blob/master/Reports/Exercise4.md, March 27, 2016.
- [8] Pyhton Software Foundation. The Python Language Reference. https://docs.python.org/2/reference/, March 27, 2016.

