@rhj
2018-01-01T13:52:58.000000Z
字数 946
阅读 82
第七次作业
homework
3.26 Continue the previous problem,and construct the phase-space plots as in Figure 3.16 and 3.17 in the different regimes.
摘要
所谓混沌就是看起来遵循确定规律的事物也会显现出超乎想象的繁复多样,只要有些微的条件的差异,就会导致令人瞠目结舌的不同结果。气象学家洛伦兹通过对天气的研究得出了混沌效应,这使得那些认为只要近似的知道一个系统的初始条件何理解自然规律就可以计算系统的近似行为的想法是错误的。这一切都来源与系统中的非线性项的存在。
洛伦兹提出的方程
其中r是表示温差影响x,y,z分别表示空气温度、密度、速度。
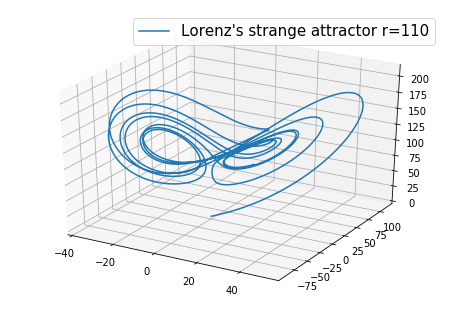
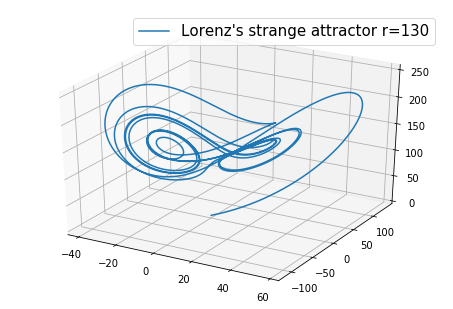
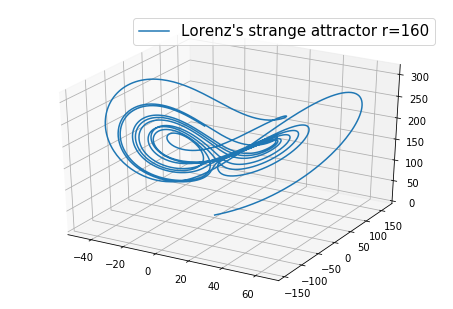
下面是不同r取值时洛伦兹双吸引子的变化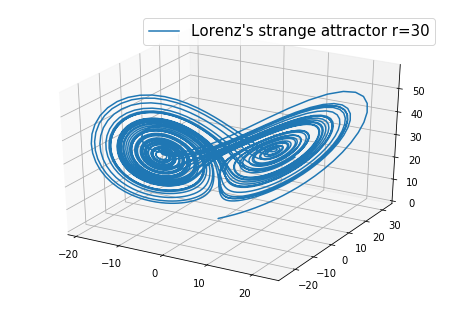 。
。
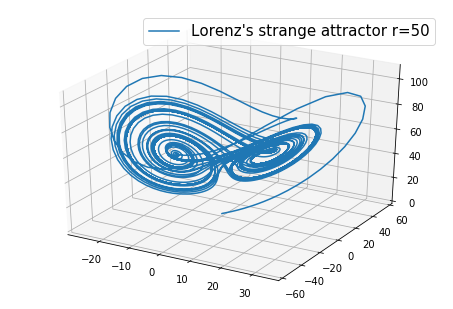
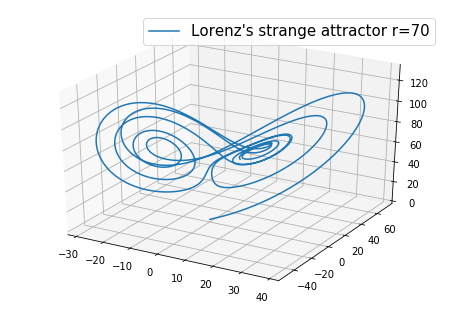
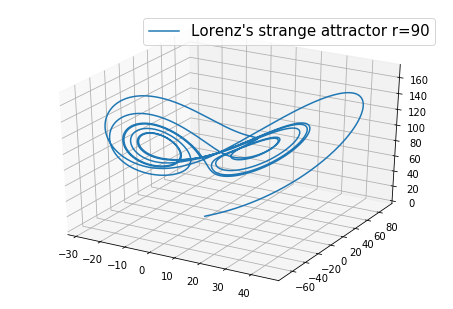
 代码如下
代码如下
import matplotlib as mpl
from mpl_toolkits.mplot3d import Axes3D
#import numpy as np
import matplotlib.pyplot as plt

xs, ys, zs = [], [], []

def mkPoints():
σ,r,b = 10.0, 160, 8.0 / 3.0
h = 0.001
x0, y0, z0 = 0.1, 0, 0
    for i in range(5000):
    x1 = x0 + h * σ * (y0 - x0)
    y1 = y0 + h * (x0 * (r - z0) - y0)
    z1 = z0 + h * (x0 * y0 - b * z0)
    x0, y0, z0 = x1, y1, z1
    xs.append(x0)
    ys.append(y0)
    zs.append(z0)

if __name__ == "__main__":
mpl.rcParams["legend.fontsize"] = 15
fig = plt.figure()
ax = Axes3D(fig)

mkPoints()
ax.plot(xs, ys, zs, label = "Lorenz's strange attractor r=160")
ax.legend()

plt.show()
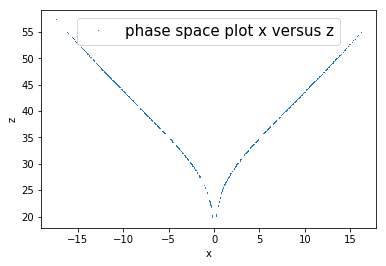
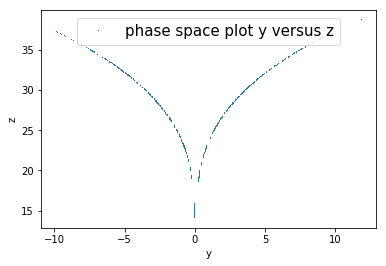
取r=35时做出相图和相面截图,如下图所示
下面是r=160时的相图
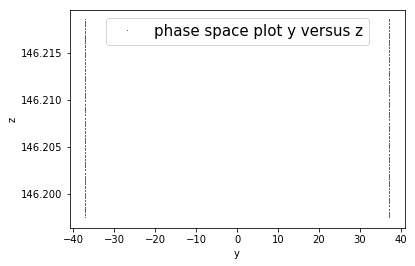
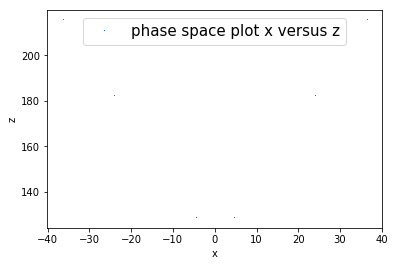
由双吸引子图可以看出其轨迹并不会重合即任何一点都是单独的,线与线之间不会相交,因为若相交就会造成重复运动。对于最后的相图可以看出对于r增大到160时相图会发生明显改变。
感谢丁冬冬学姐的代码。
