@rhj
2017-10-27T23:21:15.000000Z
字数 1362
阅读 103
第六次作业
homework
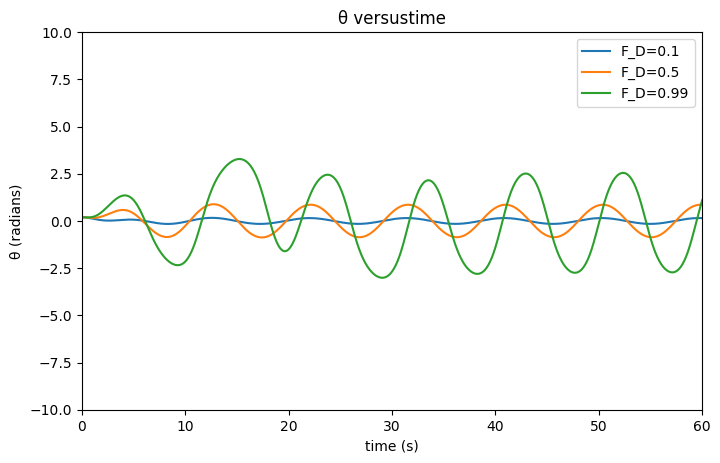
3.10 Caculate θ(t) for ,with the other paraments as in Figure 3.6.Compare the waveforms, with special attention to the deviations frome a purely sinusoidal frome a high drive.
摘要
由于用普通的欧拉法会产生累积误差,最后导致误差随时间的增大而不可忽略。故用Euler-crome方法可以初步解决这个解决带有复杂驱动力和阻力的单摆问题。
由题意可知
用Euler-crome方法可以得出
画出的θ-t曲线如图所示
程序如下
import matplotlib.pyplot as pl
import math

F_D_1=0.1
F_D_2=0.5
F_D_3=0.99
q=1/2
l=9.8
g=9.8
omega_D=2/3
dt=0.04
theta_1=[0.2]
omega_1=[0]
theta_2=[0.2]
omega_2=[0]
theta_3=[0.2]
omega_3=[0]
t=[0]
for i in range (0,int(200/dt)):
omega_1.append(omega_1[i]-((g/l)*math.sin(theta_1[i])+q*omega_1[i]-F_D_1*math.sin(omega_D*t[i]))*dt)
theta_1.append(theta_1[i]+omega_1[i+1]*dt)
omega_2.append(omega_2[i]-((g/l)*math.sin(theta_2[i])+q*omega_2[i]-F_D_2*math.sin(omega_D*t[i]))*dt)
theta_2.append(theta_2[i]+omega_2[i+1]*dt)
omega_3.append(omega_3[i]-((g/l)*math.sin(theta_3[i])+q*omega_3[i]-F_D_3*math.sin(omega_D*t[i]))*dt)
theta_3.append(theta_3[i]+omega_3[i+1]*dt)
t.append(t[i]+dt)
fig=pl.figure(figsize=(8,5),dpi=100)
line=pl.plot(t,theta_1,label='F_D=0.1')
line=pl.plot(t,theta_2,label='F_D=0.5')
line=pl.plot(t,theta_3,label='F_D=0.99')
pl.xlim(0,60)
pl.ylim(-10,10)
pl.xlabel('time (s)')
pl.ylabel('θ (radians)')
pl.legend()
pl.title('θ versustime')
pl.show()
结论
由图可以看出不同的F_D的取值对θ-t的曲线影响较大。
