@zhuchunqin
2017-01-06T14:02:36.000000Z
字数 4821
阅读 213
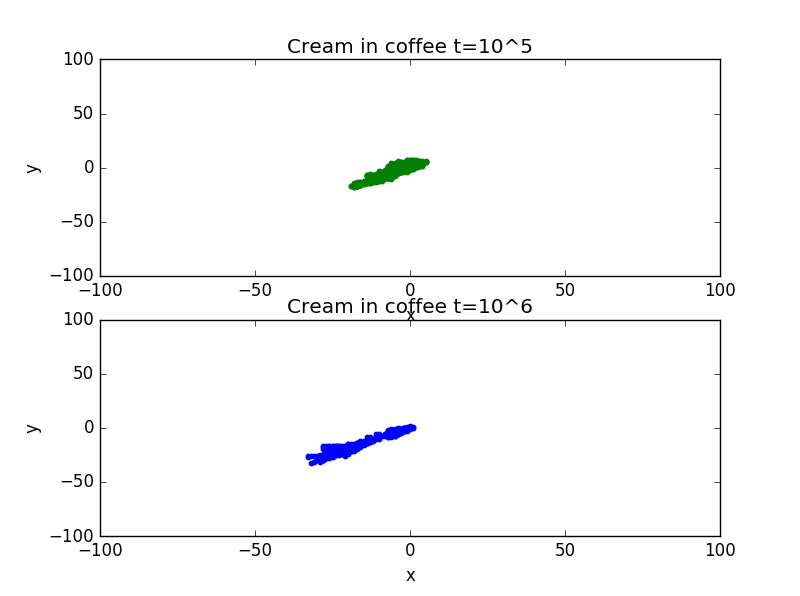
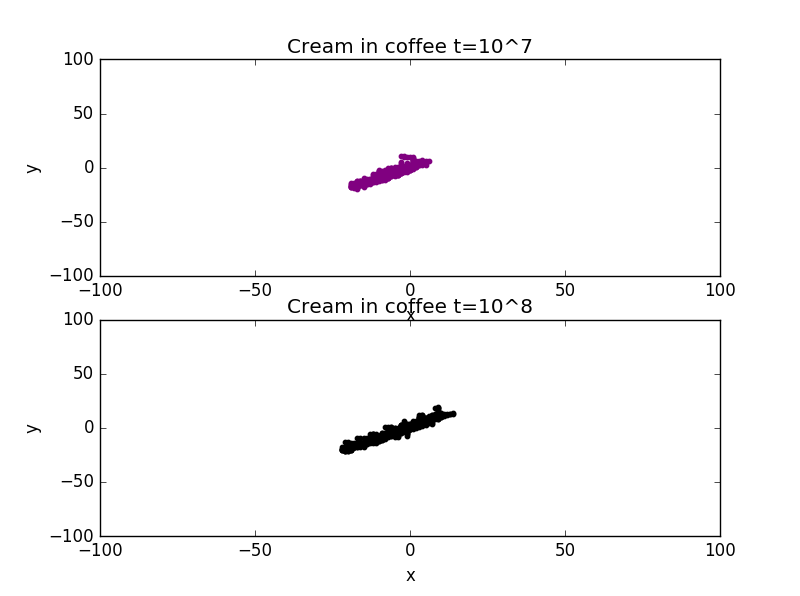
Final Project: Random systems:"random walks","random walks and diffusion" and "diffusion,entropy,and the arrow of time"
一.摘要
1.①.Routine rwalk for simulating one-dimensional random walks and the of x() with ;②.the value of with ;
2.①.The average of the displacement after n steps with ;②.the value of with ;
3.Time evolution calculated from the diffusion equation in one dimension at different values of t;
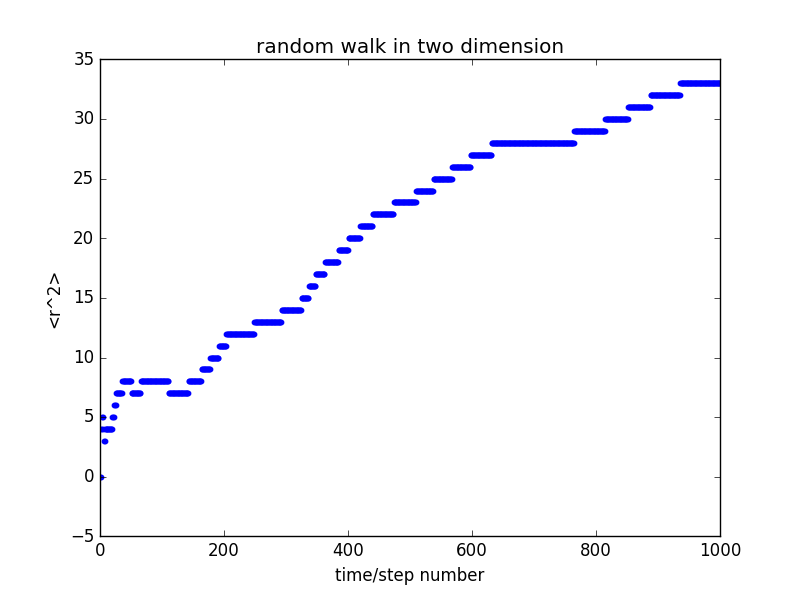
4.Random-walk simulation of diffusion of cream in coffee and the value of in two dimensions.
二.背景介绍
1.when ,we can get a random number r=rnd between 0 and 1;If r<0.5,update x to x+1,otherwise to x-1;
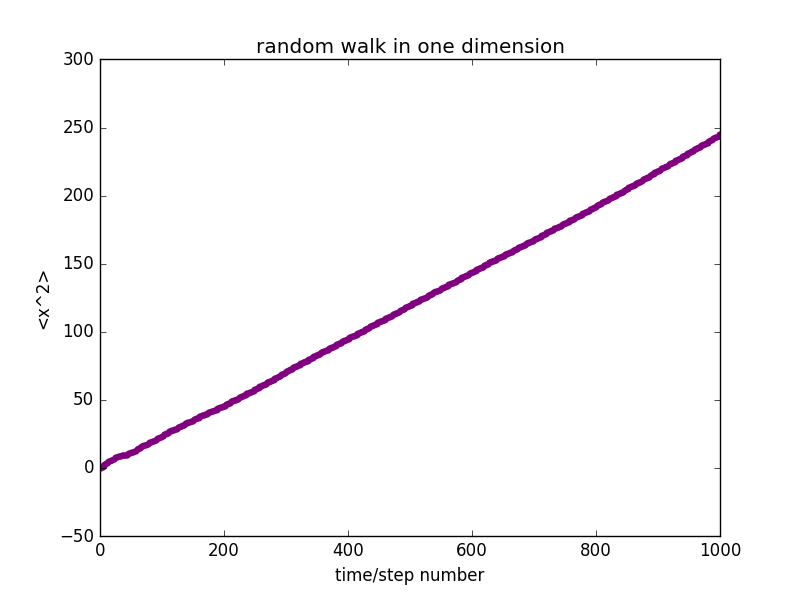
2.Firstly,initialize an array for i from 1 to n;then accumulate the squared displacement:;lastly,we can get the mean squared displacement: for i from 1 to n.
3.The total probability to arrive at x=i is:P(i,n)=1/2[P(i-1,n)+P(i+1,n);the density obeys the equation:;lastly,we can express the density:
4.,for ,similiarly,we can get a random number r=rnd between 0 and 1;If r<0.25,update x to x+1;elif r<0.5,to x-1;elif r<0.75,update y=y+1;otherwise to y-1.
三.正文
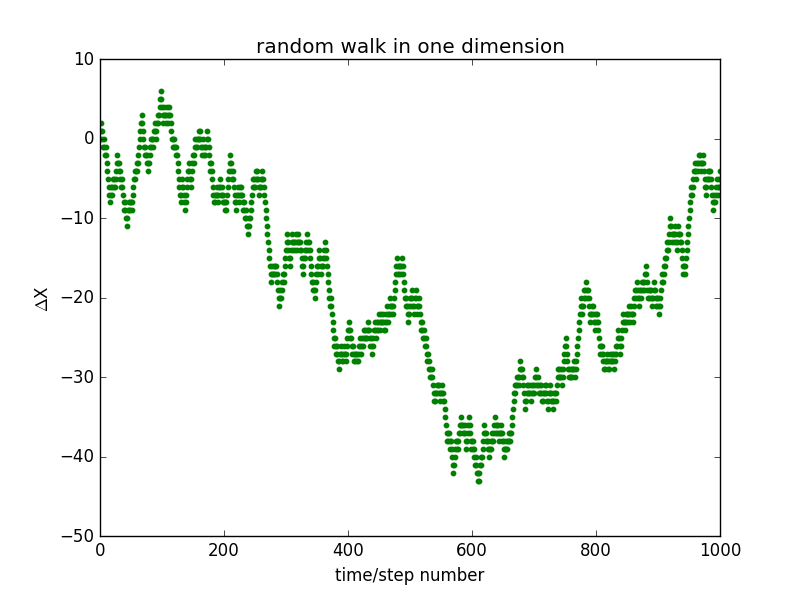
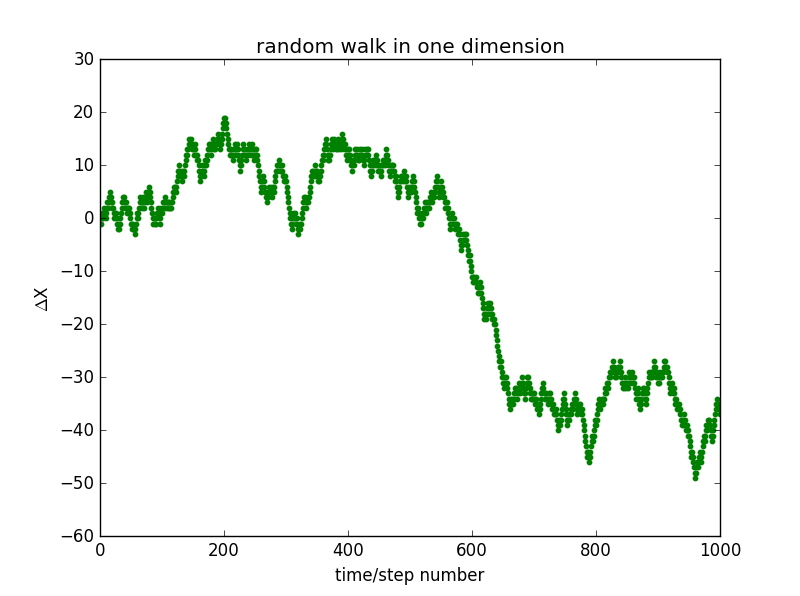
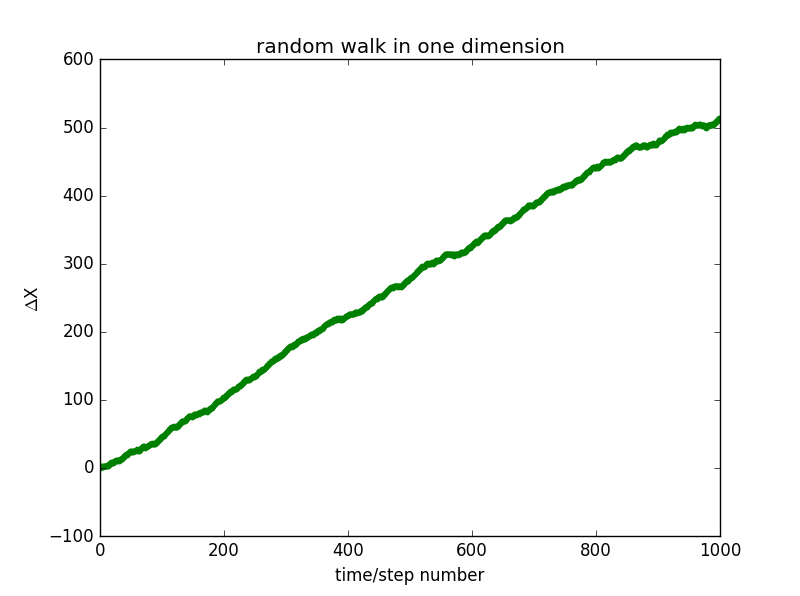
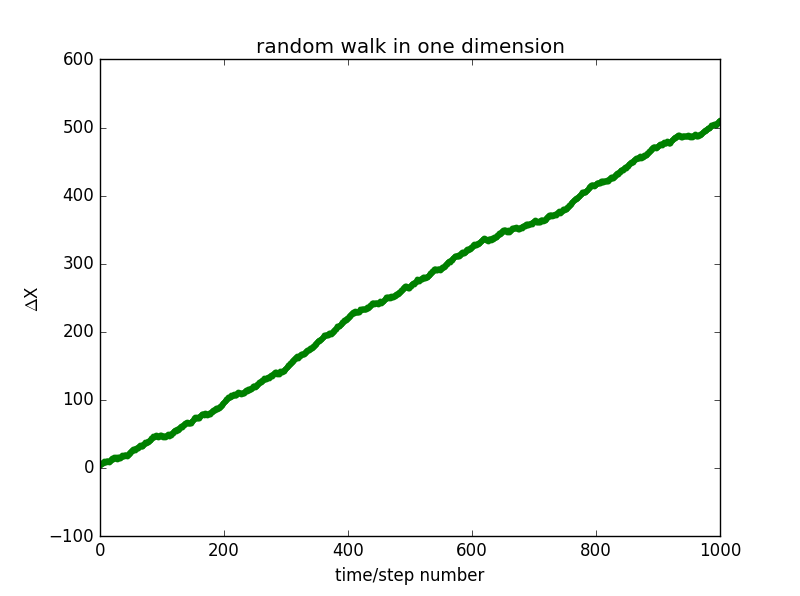
1.①,x versus step number and for two random walks in one dimension:
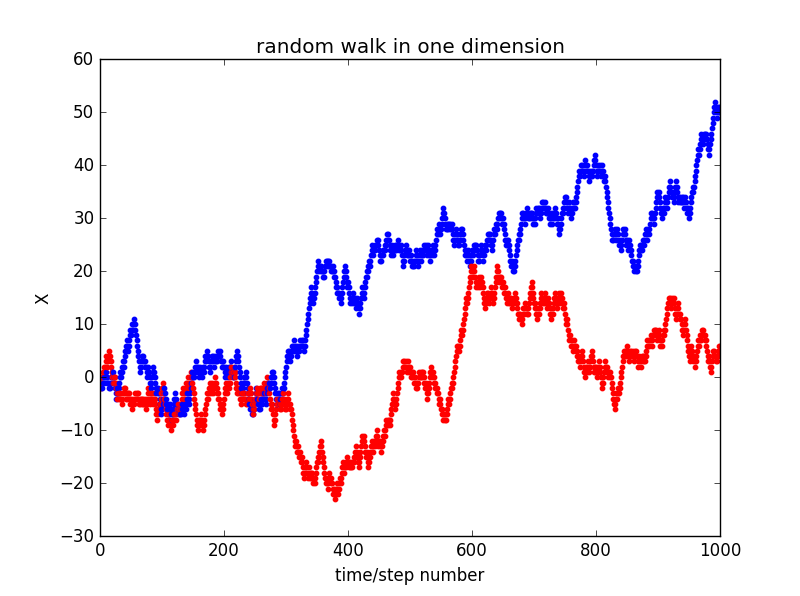
x0=0
x0=1
import random
import numpy as np
import matplotlib.pyplot as plt
import math
def randpath(tt):
    b=[]
    b1=[]
    bb=[]
    b.append(0)
    b1.append(0)
    bb.append(0)
    b_=[]
    b_1=[]
    d=[]
    for i in range(tt):
        c=random.random()
        bb.append(i+1)
        if c<=0.5:
            b.append(b[-1]+1)
            b1.append(b1[-1]+1)
        else:
            b.append(b[-1]-1)
            b1.append(b1[-1]-1)
        d.append(abs(b1[i])-abs(b[i]))
    for j in range(len(b)):
         b_.append(b[j])
    for l in range(len(b1)):
         b_1.append(b1[l])
    return b,b1,bb,b_,b_1
a,b,b1,c,d=randpath(1000)
for k in range(len(d)):
    plt.scatter(k,[d[k],],10,color='green')
plt.xlim(0,1000)
plt.xlabel('time/step number')
plt.ylabel('$\Delta$X')
plt.title('random walk in one dimension')
plt.show()
②:
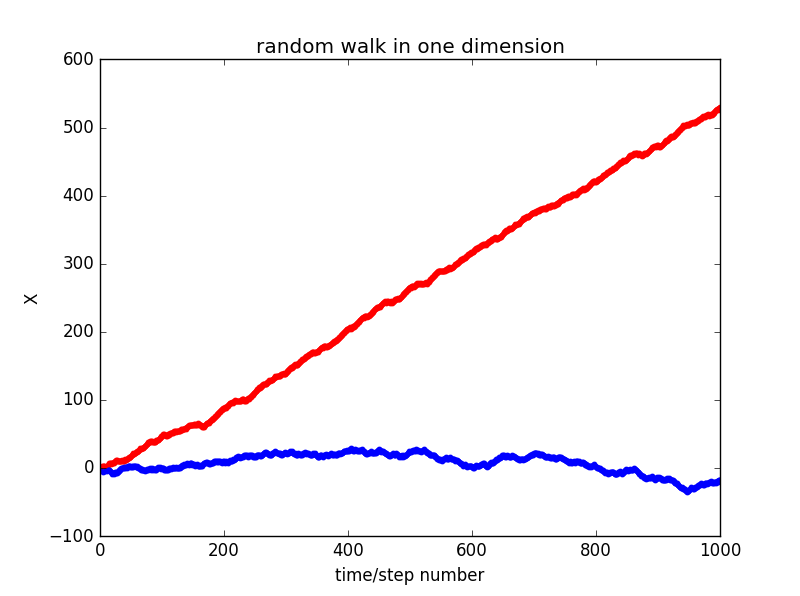
2. ①:
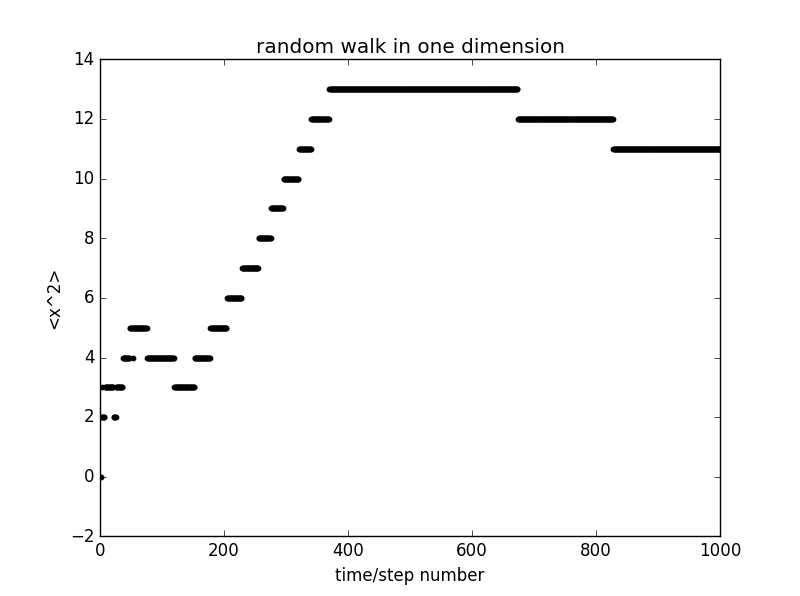
import random
import numpy as np
import matplotlib.pyplot as plt
import math
def randpath(tt):
    b=[]
    bb=[]
    a=[]
    a_=[]
    b.append(0)
    bb.append(0)
    a.append(0)
    a_.append(0)
    b2=[]
    for i in range(tt):
        c=random.random()
        bb.append(i+1)
        if c<0.75:
            b.append(b[-1]+1)
        else:
            b.append(b[-1]-1)
        a.append(abs(a[i])+abs((b[i])^2))
        if i>0:
            a_.append(a[i]/i)
        else:
            a_.append(0)
    for j in range(len(b)):
         b2.append(b[j])
    return a,a_,b,bb,b2
a,a_,b,bb,c=randpath(1000)
for k in range(len(b)):
    plt.scatter(k,[a_[k],],10,color='purple')
plt.xlim(0,1000)
plt.xlabel('time/step number')
plt.ylabel('<x^2>')
plt.title('random walk in one dimension')
plt.show()
②:
3.Diffusion in one dimension with different values of t:
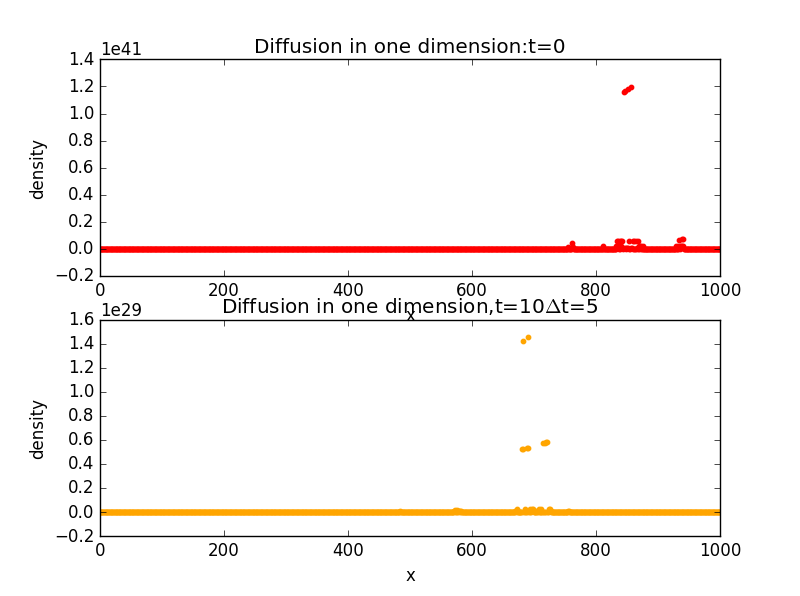
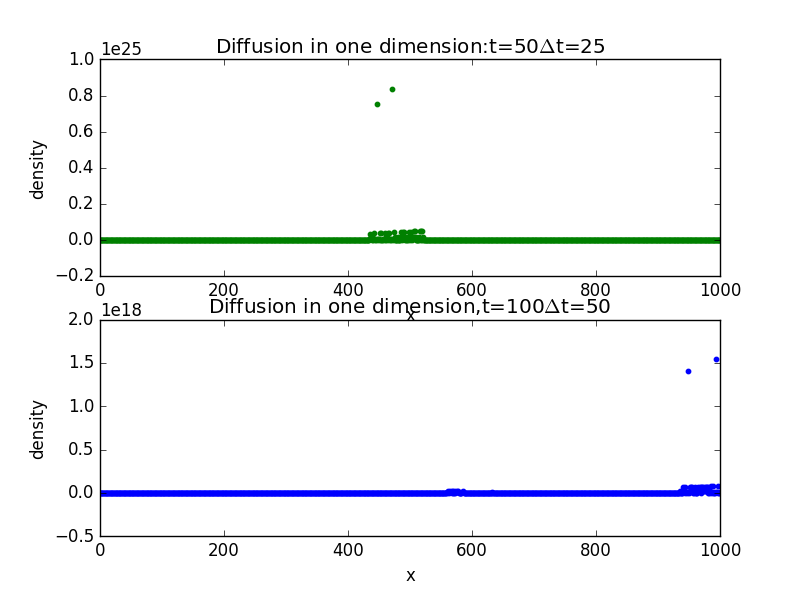
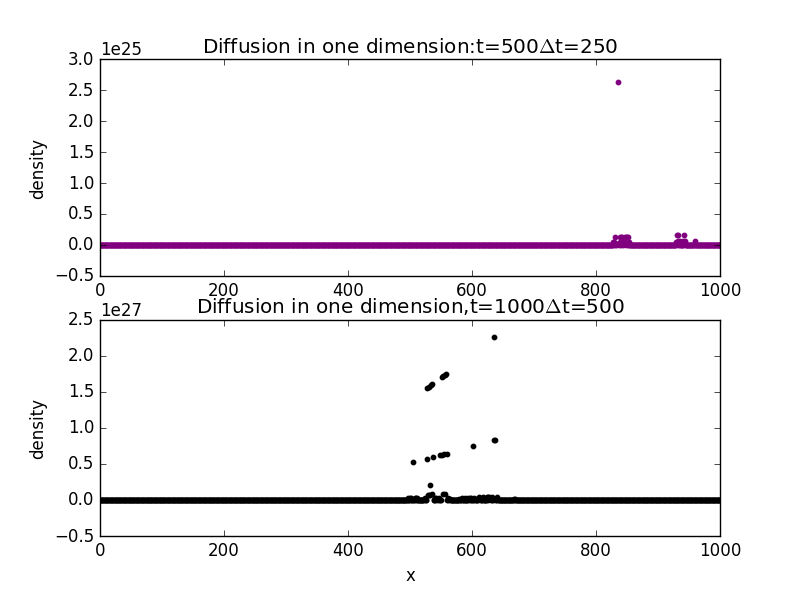
import random
import numpy as np
import matplotlib.pyplot as plt
import math
def randpath(tt):
    b=[]
    bb=[]
    a=[]
    a_=[]
    b.append(0)
    bb.append(0)
    a.append(0)
    a_.append(0)
    b2=[]
    for i in range(tt):
        c=random.random()
        bb.append(i+1)
        if c<=0.5:
            b.append(b[-1]+1)
        else:
            b.append(b[-1]-1)
        a.append(abs(math.exp(abs(-b[i]^2))*abs((4*bb[i])^(-1))))
        if bb[i]>0:
            if a[i]>0:
                a_.append((abs(a[i])*abs((2*bb[i])^(-2))))
            else:
                a_.append(0)
        elif bb[i]<=0:
            a_.append(b[i])
    a_[0]=0
    a_[-1]=0
    for j in range(len(b)):
         b2.append(b[j])
    return a,a_,b,bb,b2
plt.subplot(211)
a,a_,b,bb,c=randpath(1000)
bb[-1]=250
for k in range(len(b)):
    plt.scatter(k,[a_[k],],10,color='purple')
plt.xlim(0,1000)
plt.ylabel('density')
plt.title('Diffusion in one dimension:t=500$\Delta$t=250')
plt.subplot(212)
a,a_,b,bb,c=randpath(1000)
bb[-1]=500
for k in range(len(b)):
    plt.scatter(k,[a_[k],],10,color='black')
plt.xlim(0,1000)
plt.xlabel('x')
plt.ylabel('density')
plt.title('Diffusion in one dimension,t=1000$\Delta$t=500')
plt.show()
4.Cream in coffee with different values of t:
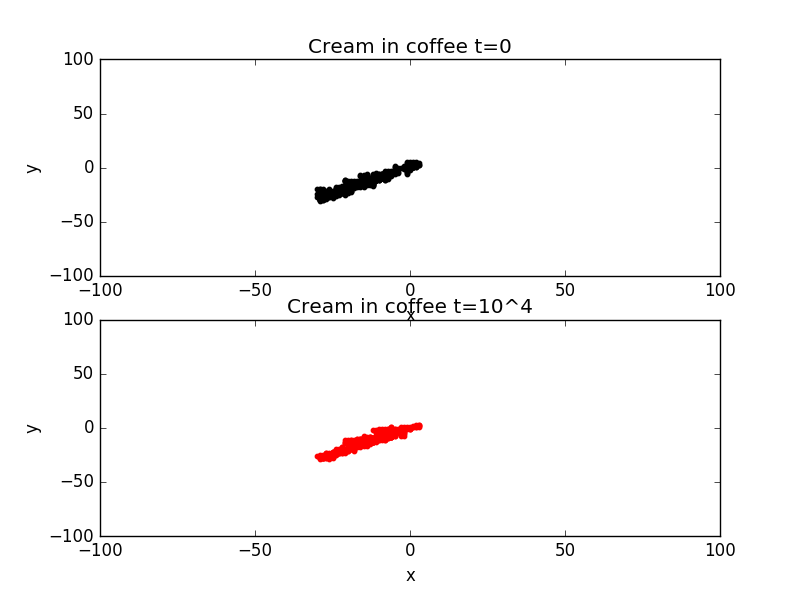
import random
import numpy as np
import matplotlib.pyplot as plt
import math
def randpath(tt):
    b=[]
    b1=[]
    bb=[]
    a=[]
    a_=[]
    b.append(0)
    b1.append(0)
    bb.append(0)
    a.append(0)
    a_.append(0)
    b2=[]
    for i in range(tt):
        c=random.random()
        bb.append(i+1)
        if c<=0.25:
            b.append(b[-1]+1)
            b1.append(b[-1])
        elif c<=0.5:
            b.append(b[-1]-1)
            b1.append(b1[-1])
        elif c<=0.75:
            b.append(b[-1])
            b1.append(b1[-1]+1)
        else:
            b.append(b[-1])
            b1.append(b1[-1]-1)
        a.append(abs(a[i])+abs((b[i])^2)+abs((b1[i])^2))
        if i>0:
            a_.append(a[i]/i)
        else:
            a_.append(0)
    for j in range(len(b)):
         b2.append(b[j])
    return a,a_,b,bb,b1
a,a_,b,bb,b1=randpath(1000)
for k in range(len(b)):
    plt.scatter([b[k],],[b1[k],],10,color='blue')
plt.xlim(0,1000)
plt.xlabel('time/step number')
plt.ylabel('x')
plt.title('random walk in two dimension')
plt.show()
