@zhuchunqin
2016-12-18T03:30:01.000000Z
字数 1365
阅读 274
Exercise_13: Chapter 6 problem 6.13
一摘要:
Conder the power spectra for waves on a string as a function of where the string vibration is observed ,.
二背景介绍:
1.the central equation of wave motion is:
2.when ,
3.the initial string profile is
三正文:
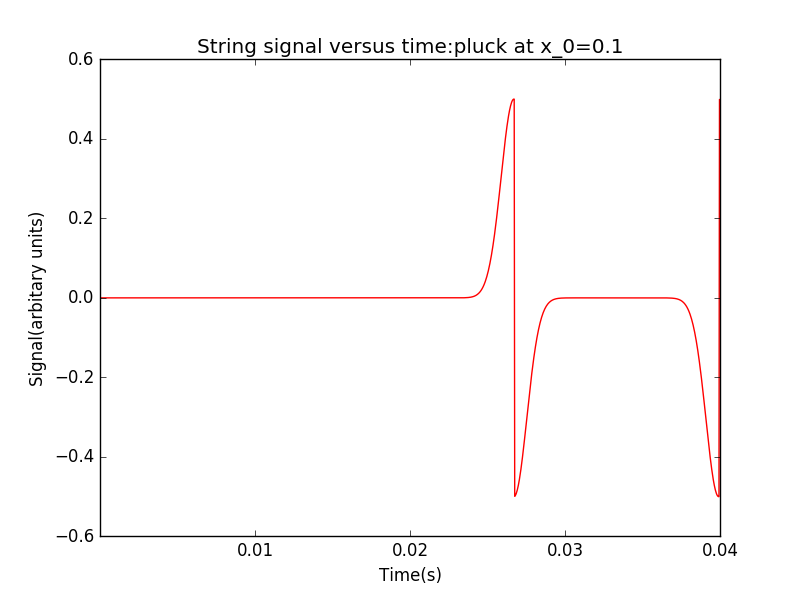
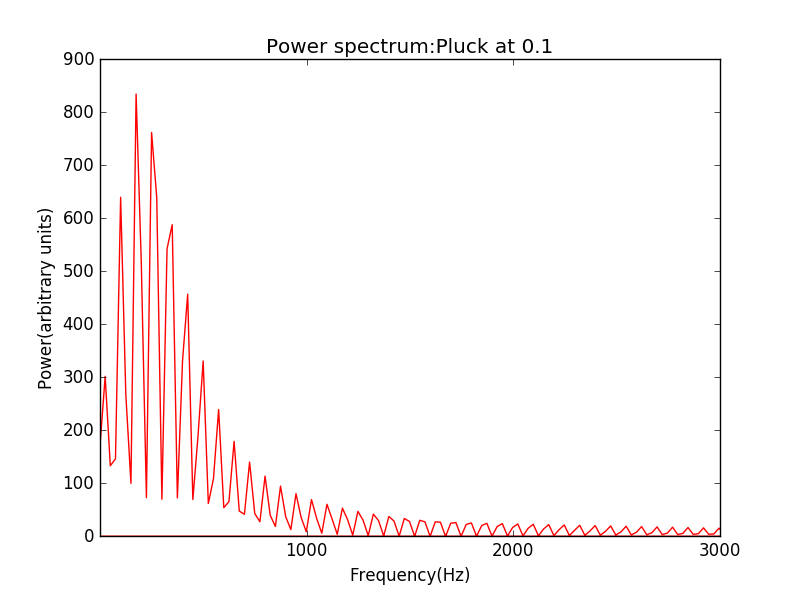
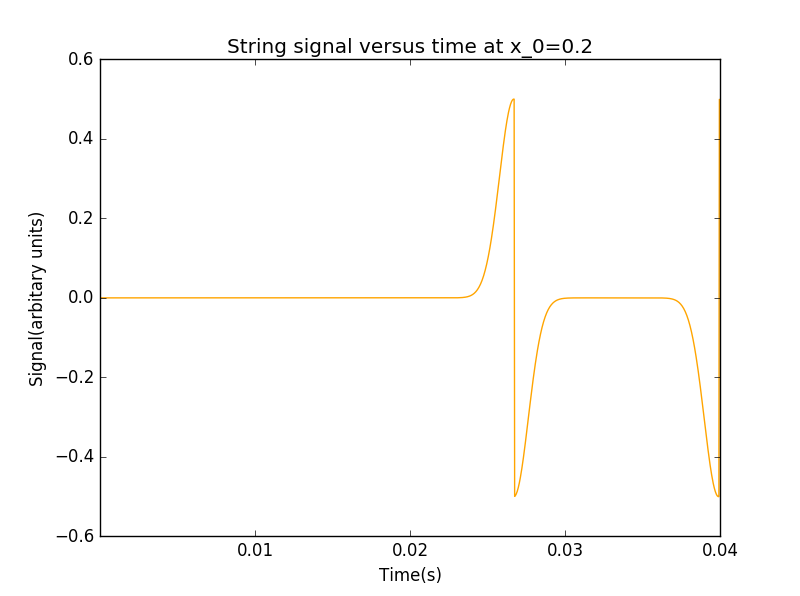
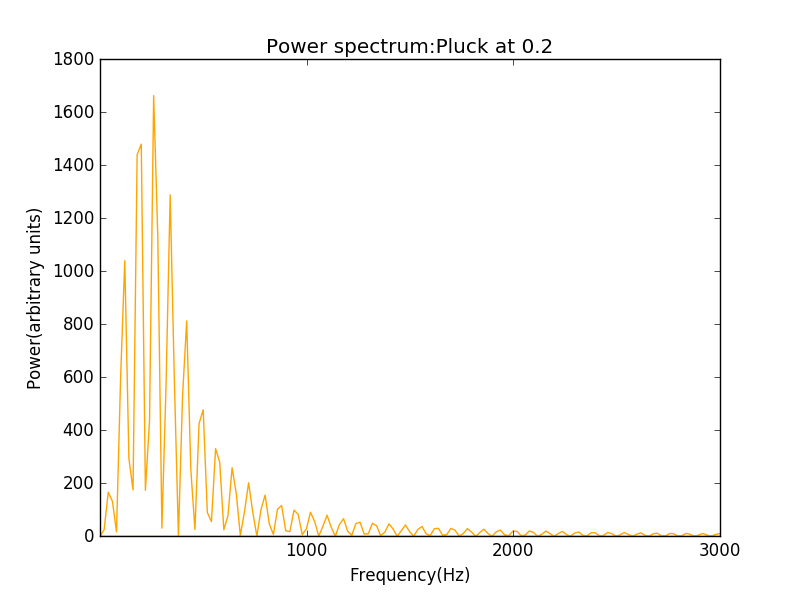
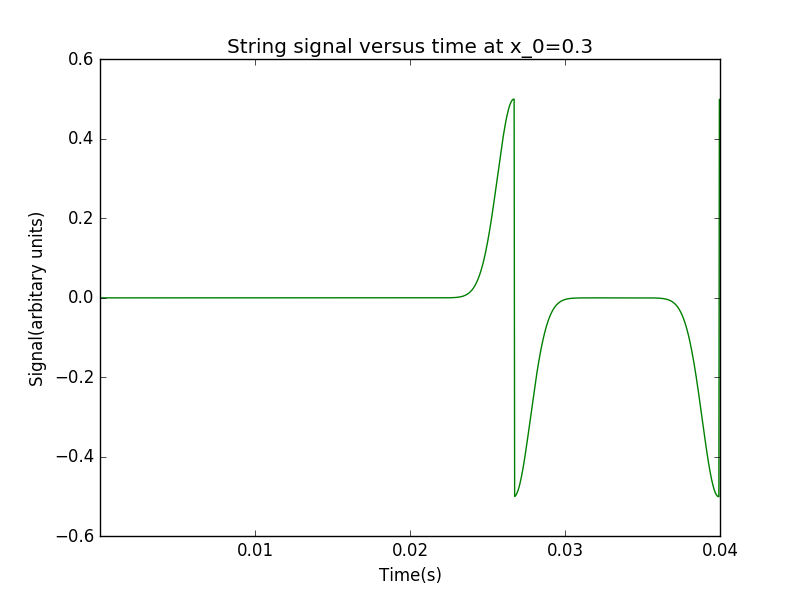
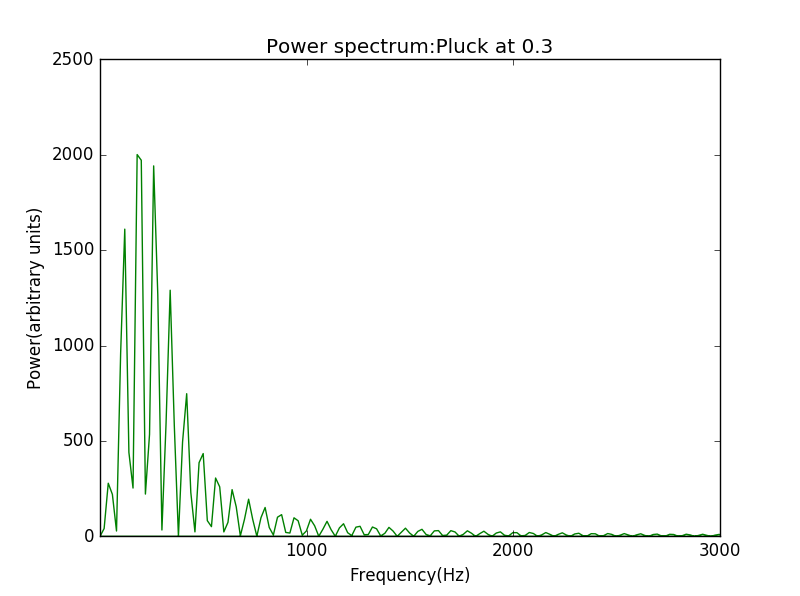
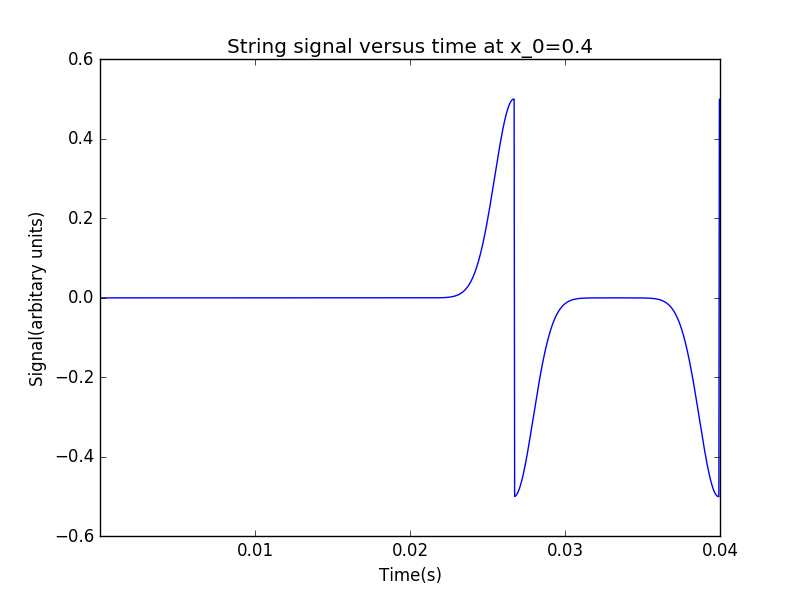
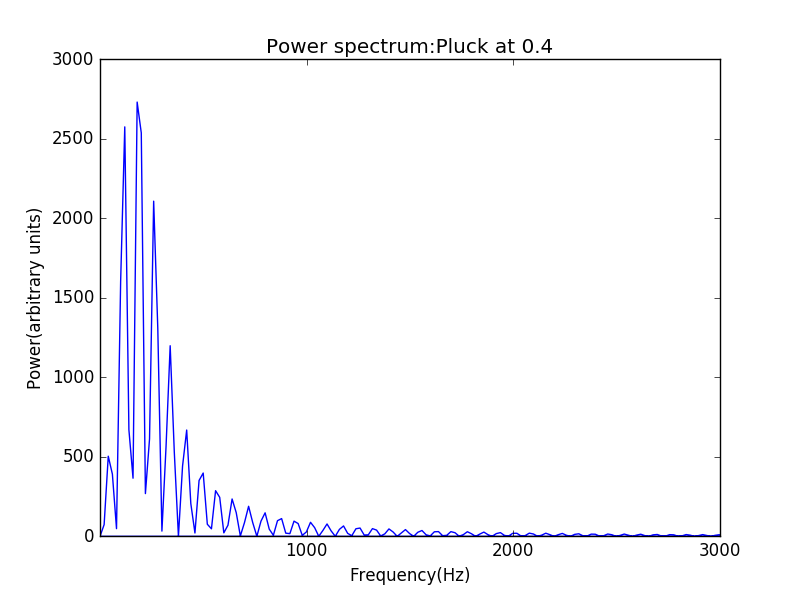
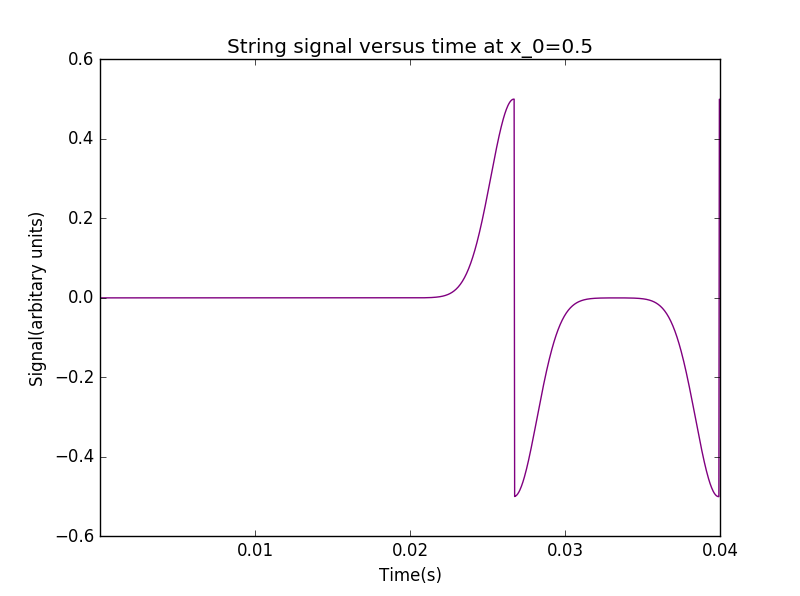
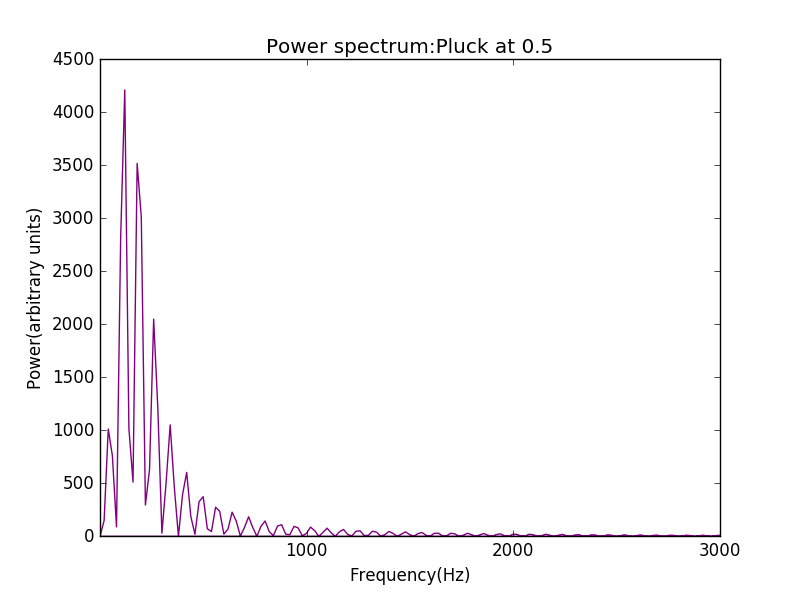
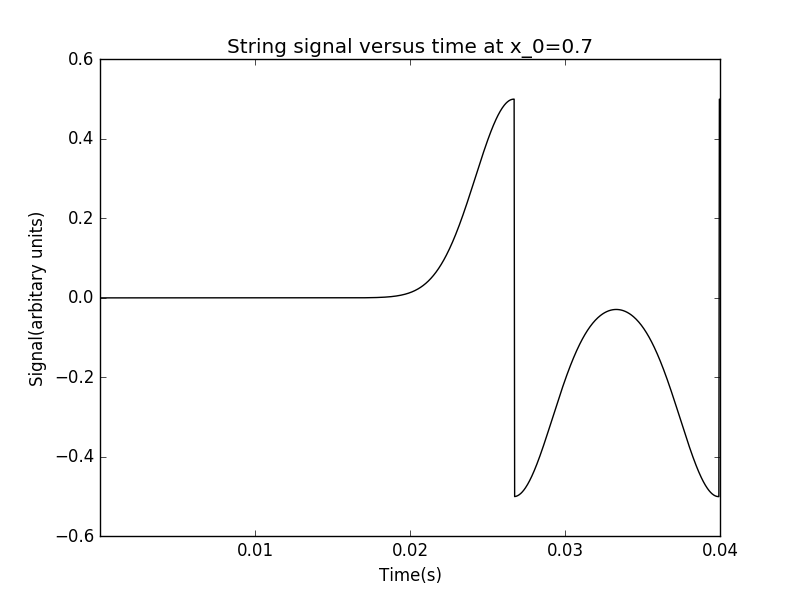
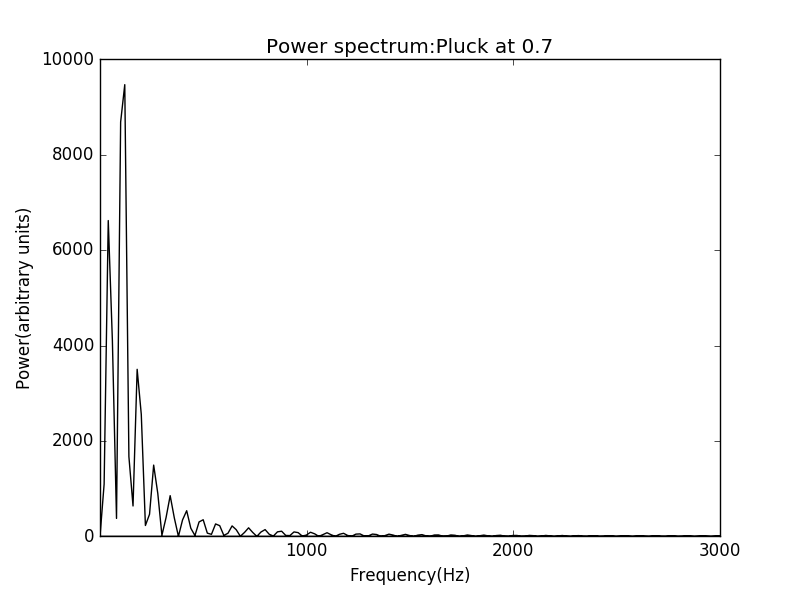
When is 0.1,0.2,0.3,0.4,0.5,0.7,here are the results:
from matplotlib import animation
from pylab import*
import numpy as np
c=300
dx=0.01
l=np.linspace(0,1,1000)
def w():
    y=[]
    dt=dx/c
    t=0.0
    y0=np.exp(-1000*(l-l*0.2)**2)
    y.append(y0)
    while t<0.05:
        y_next=np.zeros(1000)

        for i in range(1,998):
            y_next[i]=-y[-2][i]+y[-1][i+1]+y[-1][i-1]

        y.append(y_next)
        t=t+dt
    return y, t
a=w()[0]
'''
for iter in a01:
   print type(a01)
   '''
b=[a_iter[800] for a_iter in a]
print len(b)
e=len(b)
d=linspace(0,dx/c*e,e)
plot(d,b,'orange')
xlim(0,0.05)
plt.xticks([0.01,0.02,0.03,0.04,0.05])
xlabel('Time(s)')
ylabel('Signal(arbitary units)')
title('String signal versus time at x_0=0.2')
show()
y2=np.fft.fft(b)
f=np.fft.fftfreq(len(b),dx/c)
y2=abs(y2)**2
plot(f,y2,'orange')
xlim(0,3000)
plt.xticks([1000,2000,3000])
xlabel('Frequency(Hz)')
ylabel('Power(arbitrary units)')
title('Power spectrum:Pluck at 0.2')
show()
