@zhuchunqin
2016-11-13T07:26:09.000000Z
字数 2504
阅读 174
Exercise_08: Chapter 3 problem 3.20
一.摘要:
.Calculate the bifurcation diagram for the pendulum in the vicinity of to 1.5.Make a magnified plot of the diagram and obtain an estimate of the Feigenbaum parameter.
二.背景介绍(公式推导):
1.The equation of the motion of pendulum:
2.Two first-order differential equations:
3.So,when :
三.正文:
import math
import matplotlib.pyplot as plt
g=9.8
dt=0.01
def adjust(theta):
while theta>math.pi:
theta=theta-2*math.pi
while theta<-math.pi:
theta=theta+2*math.pi
return theta
def EC(omega0,theta0,q,l,FD,omegaD,T):
motion=[[]for i in range(3)]
motion[0].append(omega0)
motion1.append(theta0)
motion2.append(0)
while motion2[-1]<=T:
motion[0].append(motion[0][-1]+(-g*math.sin(motion1[-1])/l-q*motion[0][-1]+FD*math.sin(omegaD*motion2[-1]))*dt)
motion1.append(motion1[-1]+motion[0][-1]*dt)
motion2.append(motion2[-1]+dt)
return motion#omega,theta,t
omegaD=float(2.0/3)
T=1000
def Poin(motion):
poi=[[]for i in range(3)]
for n in range(int(omegaD*T/2/math.pi)):
number=int(round(2*n*math.pi/omegaD/dt))
poi[0].append(motion[0][number])
poi1.append(motion1[number])
poi2.append(motion2[number])
return poi
def bif(motion,FD):
m=[[]for i in range(2)]#FD,theta
for j in range(30,60):
num=int(round(2*j*math.pi/omegaD/dt))
m[0].append(FD)
m1.append(motion1[num])
return m
for i in range(150):
F_D=1.35+i*0.001
d=EC(0,0.2,0.5,9.8,F_D,2.0/3,600)
b=bif(d,F_D)
plt.plot(b[0],map(adjust,b1),'.',markersize=3.0,color='k')
plt.title('Bifurcation diagram versus ')
plt.xlim(1.35,1.50)
plt.ylim(1,3)
plt.show()
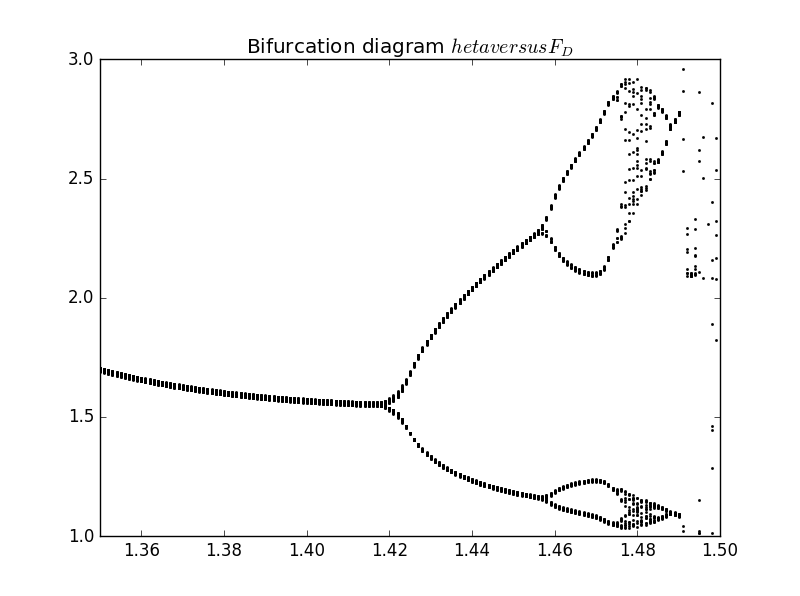
1.Bifurcation diagram for our pendulum with

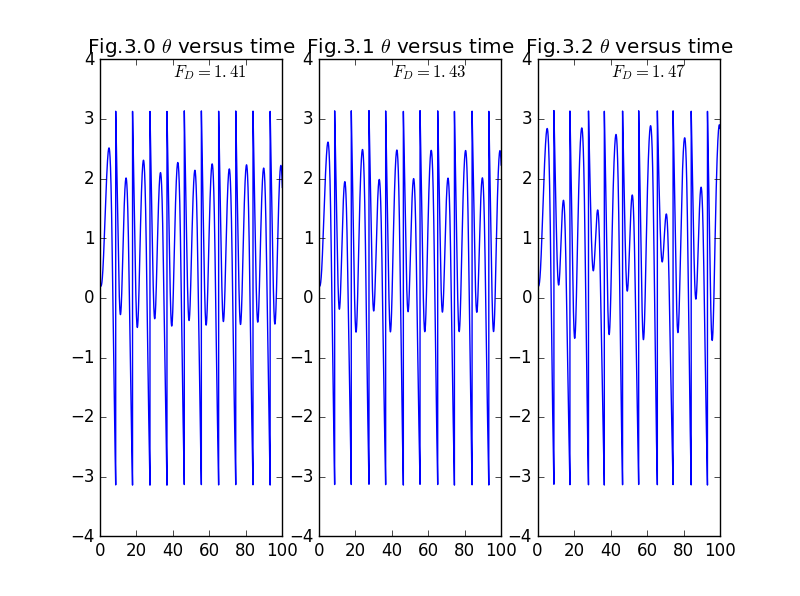
2.Results for as a function of time for

On the left the period is the same as the drive period,in the middle the period is twice the drive period,and on the right the period is four times the drive period.
3.
四.结论:
1.
2.Figure2 is consistent with Figure1(On the left the period is the same as the drive period,in the middle the period is twice the drive period,and on the right the period is four times the drive period.);
五.致谢:
Thanks to Junyishangguan for reference.
