@Billy-The-Crescent
2019-06-20T13:45:46.000000Z
字数 9294
阅读 988
计生项目实践-mt
计算生物学 项目 Protocol 马涛
添加环境变量:
export PATH=/data/apps/vcftools/vcftools-0.1.15/bin:$PATHexport PATH=/data/apps/plink/20181202:$PATHexport PATH=/data/apps/admixture/1.3.0:$PATHexport PATH=/data/apps/treebest/1.9.2/:$PATH
1 vcf文件过滤
vcf格式是用来保存SNP的格式文件,样式如下:
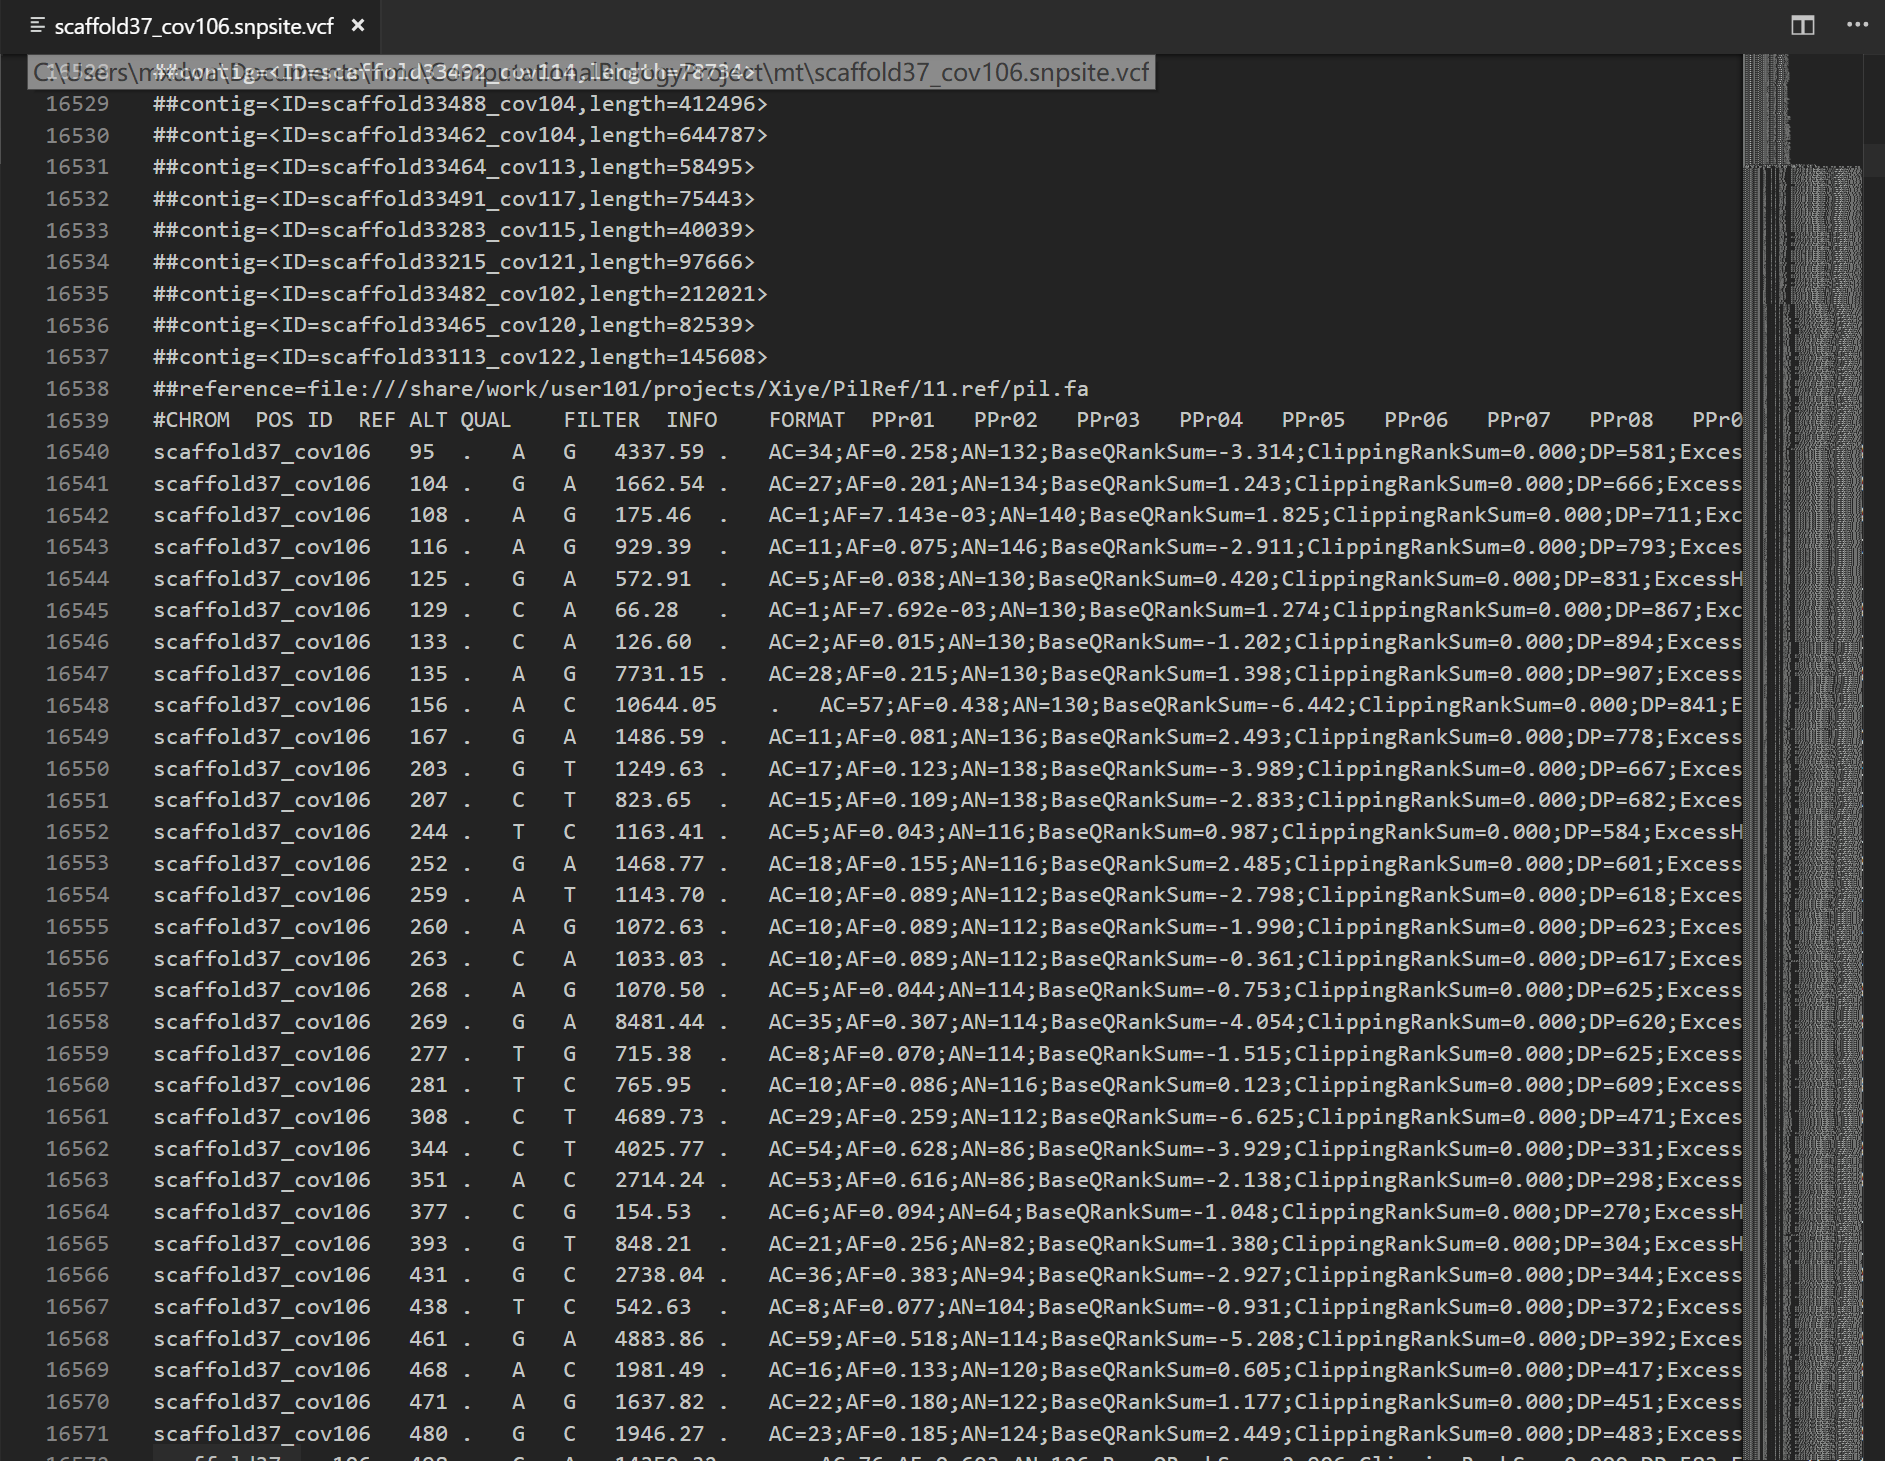
vcf格式详解
在一系列的header之后(##),有一行(#)表示表格抬头。之后开始SNP位点信息,每一行都是一个SNP位点,从左到右依次是染色体名-SNP在染色体位置-ID-参考基因组中所对应的碱基-研究对象基因组中所对应的碱基-质量值···
在FORMAT后面是每一个样本在该位点上的SNP信息。1/0表示含有REF和ALT两个等位基因 (杂合子)。0/0表示该位点是纯合的REF,反之1/1表示该位点是纯合的ALT。
有时候一个vcf文件包含的SNP位点或者样本数太多,需要删除一部分而保存另一部分值,因此需要对vcf文件进行过滤。
过滤有两种方法,keep和remove,这里使用keep方法。首先需要在一个keep.list中表明想要保留的样本名字 (注意大小写)。
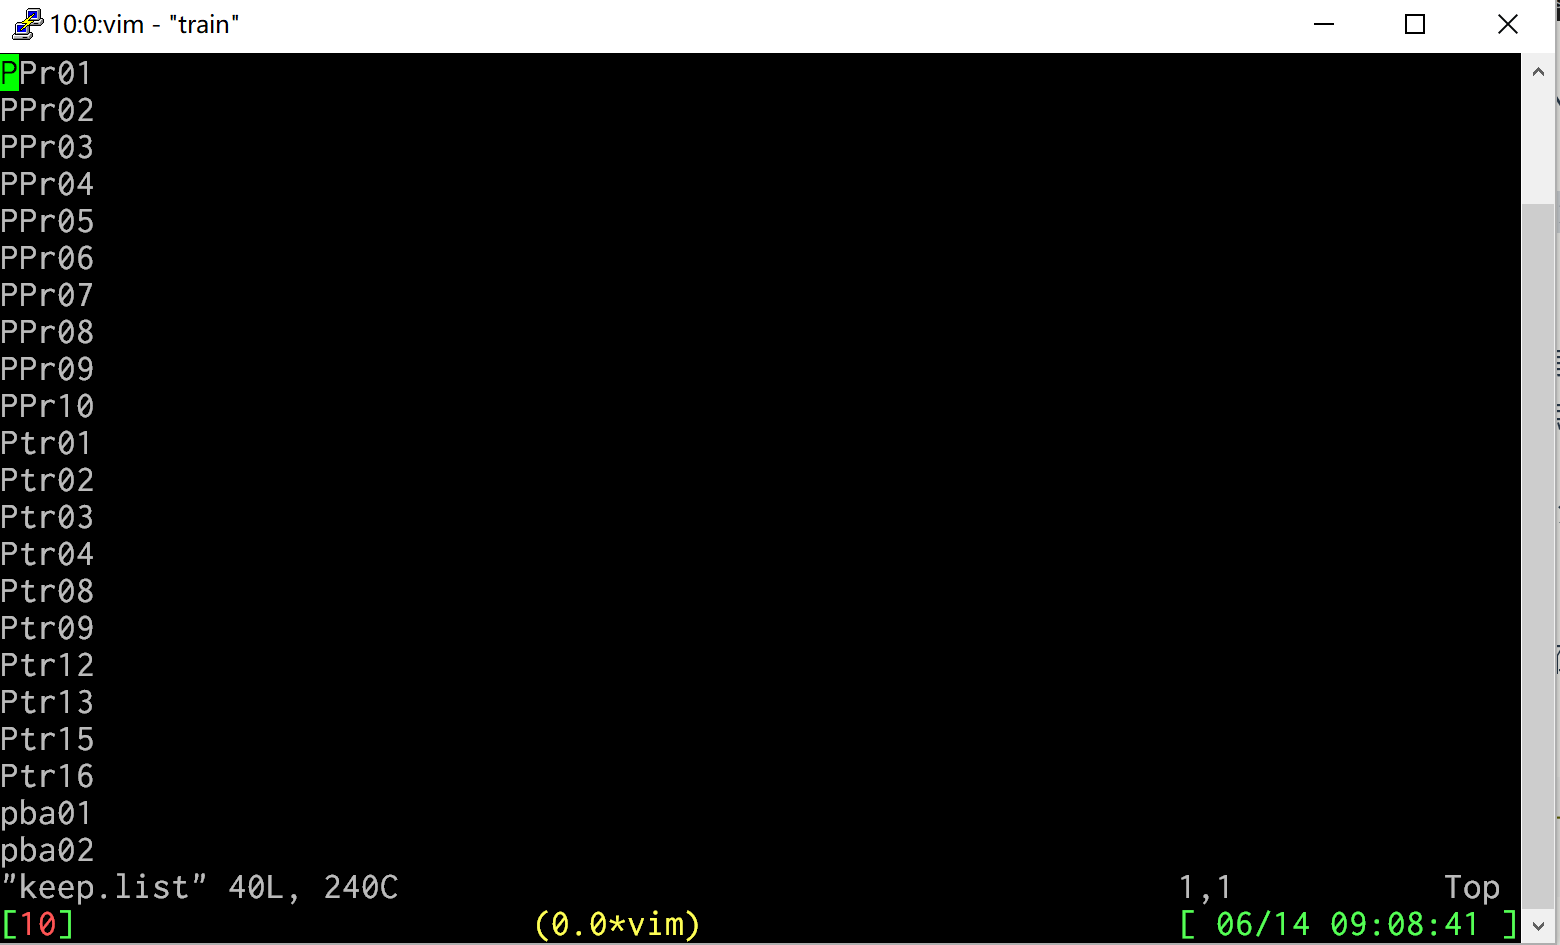
然后输入一下命令进行过滤。其中--gzvcf表示读取的是gz压缩的vcf文件,--keep表示按照keep.list中的样本保留SNP;--max-missing是用来过滤vcf文件的位点,舍弃掉missing ratio大于0.01的位点;--recode表示另外生成一个vcf文件。保留之前的vcf文件不变。
vcftools --gzvcf scaffold37_cov106.snpsite.vcf.gz --keep keep.list --max-missing 0.01 --out keep.snpsite --recode
2 主成分分析 (PCA)
使用软件:plink
使用plink软件的参数--pca进行PCA分析,输出keep.snpsite.pca
plink --vcf keep.snpsite.recode.vcf --pca --allow-extra-chr --out keep.snpsite.pca
输入命令后,得到:
- keep.snpsite.pca.eigenval
- keep.snpsite.pca.eigenvec
- keep.snpsite.pca.log
- keep.snpsite.pca.nosex
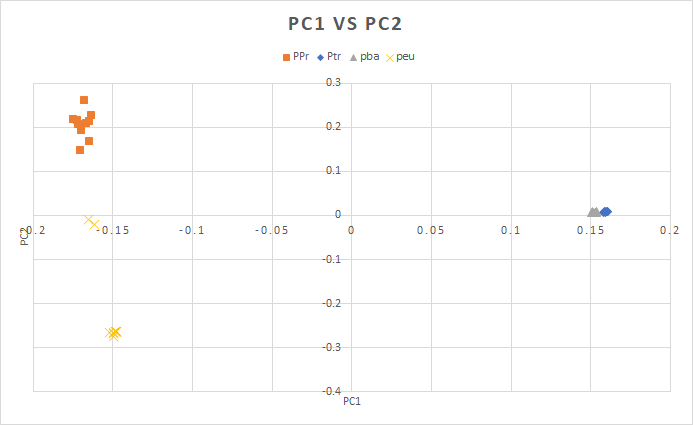
将keep.snpsite.pca.eigenvec传输到主机端,使用R语言或Excel进行画图。该文件第一列和第二列是名字,第三列开始是主成分,其中第三列是第一主成分。
若使用Excel画图,选择散点图,选择数据,调整图例,得到如下结果:
若使用R语言画图:
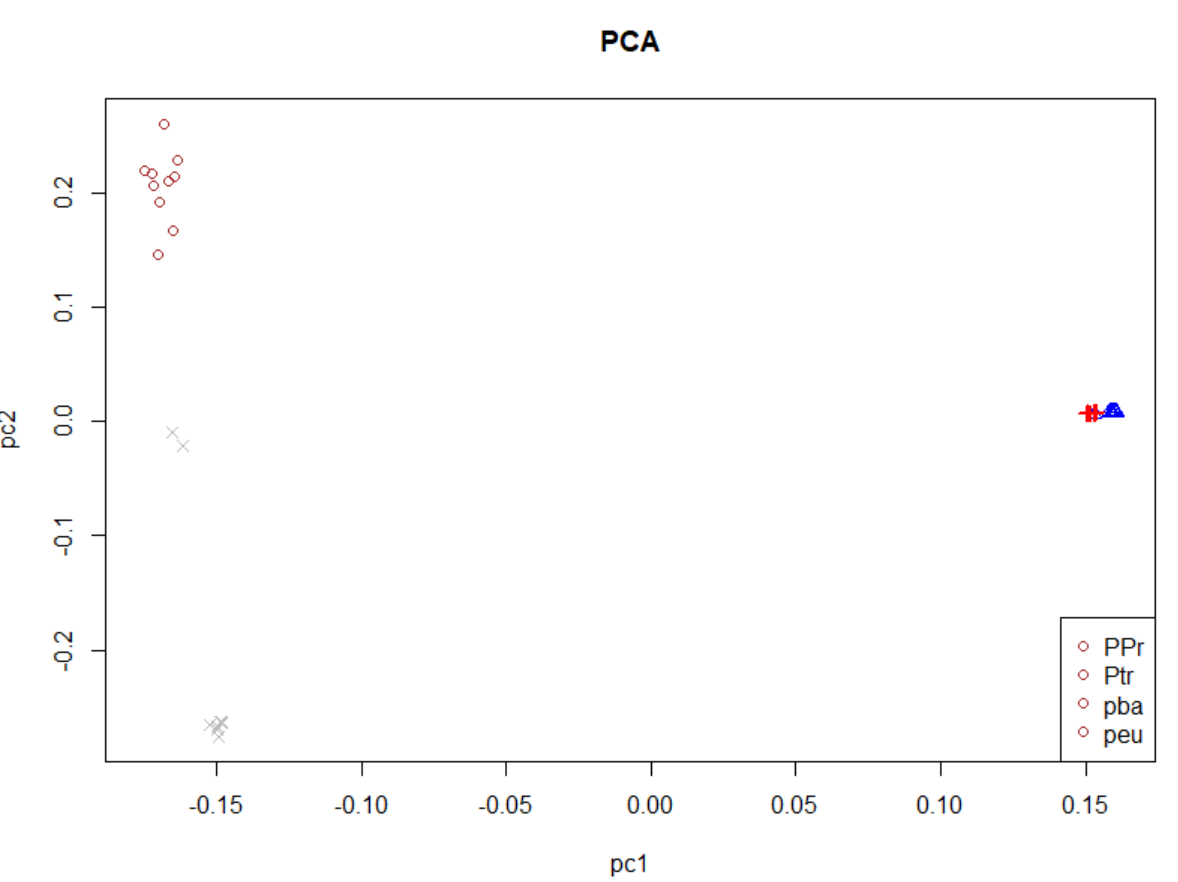
PCA=read.table("C:/Users/mxdwa/Documents/hmc/ComputationalBiologyProject/mt/mt第二次课/filtered.pca.eigenvec",header=TRUE)plot(PCA$pc1,PCA$pc2,pch=c(rep(1,10),rep(2,10),rep(3,10),rep(4,10)),col=c(rep("brown",10),rep("blue",10),rep("red",10),rep("grey",10)),main="PCA",xlab="pc1",ylab="pc2")legend("bottomright",c("PPr","Ptr","pba","peu"),pch=c(rep(1,10),rep(2,10),rep(3,10),rep(4,10)),col=c(rep("brown",10),rep("blue",10),rep("red",10),rep("grey",10)))
结果如下:
3 Build Tree
使用软件:treebest
由于绘制系统发育树需要FASTA格式文件,因此需要首先将vcf文件转化为FASTA文件。对于每个物种来说,如果一个位点是纯合的(0/0或1/1),那么在FASTA中响应位点就是单核苷酸(1/1就是ALT,0/0就是REF)。如果一个位点是SNP(0/1),那么该位点需要用简并核苷酸表示。
这里使用一个perl脚本完成这部分工作,使用如下:
perl treeBest.pl keep.snpsite.recode.vcf
然后将文件重命名,使用treebest软件画树
mv treeBest.pl.fasta keep.snpsite.recode.fastatreebest nj -b 0 keep.snpsite.recode.fasta > keep.snpsite.recode.tree
执行该命名后,会生成文件:
- keep.snpsite.recode.tree
将生成的.tree文件转移到主机,使用在线版网站tree viewer绘制树图
在该网站上,只需要提交newick格式的.tree文件就可以了,不需要提交FASTA格式文件。点击view tree!绘制进化树。
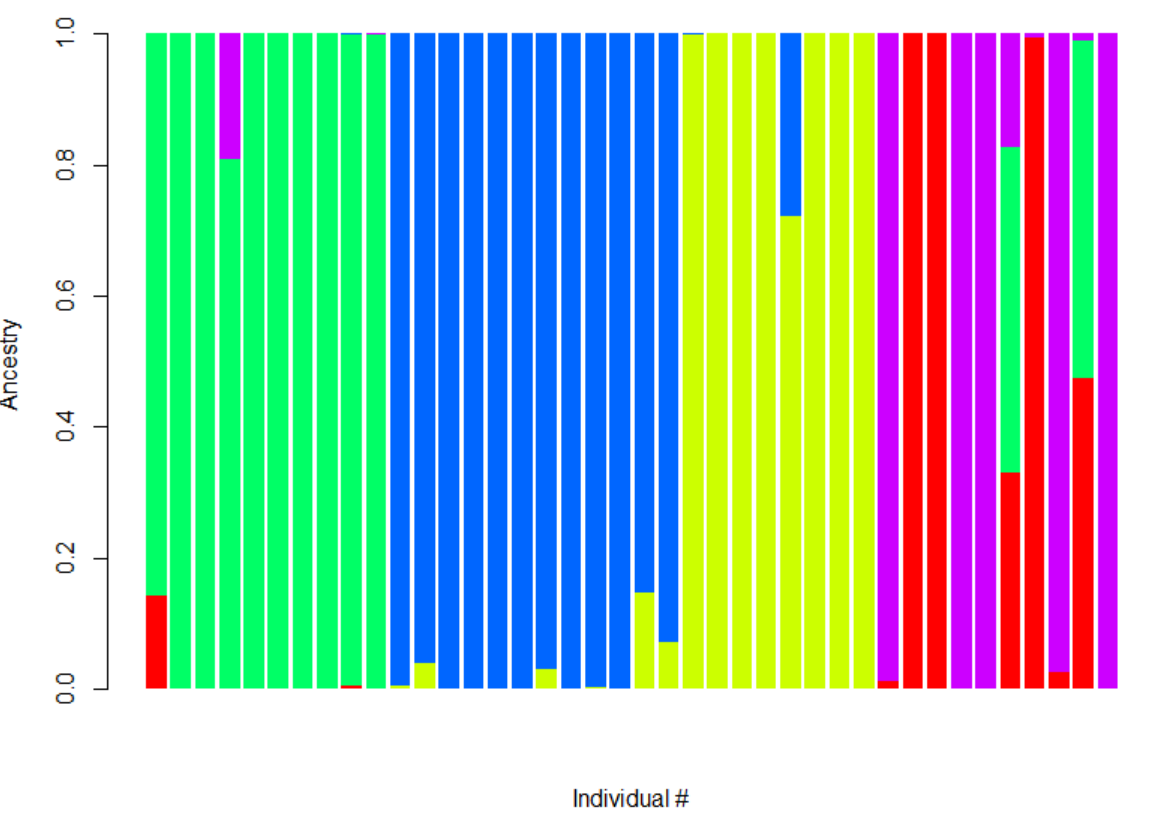
4 个体祖先的最大似然估计
使用软件:admixture
由于admixture需要输入.ped或.bed格式的文件,因此需要首先将vcf格式文件转化为.ped或.bed格式文件。这里将vcf格式文件转化为bed文件格式。
#vcf to pedvcftools --vcf keep.snpsite.recode.vcf --plink --out keep.snpsite.recode.admixture#ped to bedplink --file keep.snpsite.recode.admixture --make-bed --out keep.snpsite.recode.admixture
然后使用admixture利用bed文件计算P值和Q值
admixture keep.snpsite.recode.admixture.bed 1admixture keep.snpsite.recode.admixture.bed 2admixture keep.snpsite.recode.admixture.bed 3admixture keep.snpsite.recode.admixture.bed 4admixture keep.snpsite.recode.admixture.bed 5
Question:
如何选择合适的k值?
思想是将可能的k值都使用一遍,并输出计算误差,然后选择误差最小的那个k值作为最终的k值,使用如下命令:
for k in 1 2 3 4 5; do admixture --cv keep.snpsite.recode.admixture.bed $k | tee log${k}.out;done
其中,--cv表示输出误差。
再使用grep -h CV *out命令查看输出,结果如下:

选择误差最小的k=3作为k值。
计算得到的.Q文件可以用R语言画图。
在R语言中,首先读取各个.Q文件
tb1 = read.table("C:/Users/mxdwa/Documents/hmc/ComputationalBiologyProject/mt/mt第二次课/keep.snpsite.recode.admixture.1.Q")tb2 = read.table("C:/Users/mxdwa/Documents/hmc/ComputationalBiologyProject/mt/mt第二次课/keep.snpsite.recode.admixture.2.Q")tb3 = read.table("C:/Users/mxdwa/Documents/hmc/ComputationalBiologyProject/mt/mt第二次课/keep.snpsite.recode.admixture.3.Q")tb4 = read.table("C:/Users/mxdwa/Documents/hmc/ComputationalBiologyProject/mt/mt第二次课/keep.snpsite.recode.admixture.4.Q")tb5 = read.table("C:/Users/mxdwa/Documents/hmc/ComputationalBiologyProject/mt/mt第二次课/keep.snpsite.recode.admixture.5.Q")
将读取的.Q文件画图,下面每一行命令都可以画一幅图。
barplot(t(as.matrix(tb1)), col=rainbow(1), xlab="Individual #", ylab="Ancestry", border=NA)barplot(t(as.matrix(tb2)), col=rainbow(2), xlab="Individual #", ylab="Ancestry", border=NA)barplot(t(as.matrix(tb3)), col=rainbow(3), xlab="Individual #", ylab="Ancestry", border=NA)barplot(t(as.matrix(tb4)), col=rainbow(4), xlab="Individual #", ylab="Ancestry", border=NA)barplot(t(as.matrix(tb5)), col=rainbow(5), xlab="Individual #", ylab="Ancestry", border=NA)
结果类似这样:
5 为每个物种计算值
值核苷酸多样性,越大说明核苷酸多样性越高,越低说明两个座位DNA序列差异越小。
这里计算每个物种内部的差异。
使用软件:vcftools
首先,需要对源文件进行过滤,得到单一物种的vcf文件
源文件:keep.snpsite.recode.vcf
为每个物种创建一个list,保存该物种内的个体名称,见第一部分vcf文件过滤。
得到:
- PPr.list
- Ptr.list
- pba.list
- peu.list
开始过滤,同时计算pi值:
vcftools --vcf keep.snpsite.recode.vcf --keep pba.list --site-pi --out pba.list.sitePivcftools --vcf keep.snpsite.recode.vcf --keep peu.list --site-pi --out peu.list.sitePivcftools --vcf keep.snpsite.recode.vcf --keep PPr.list --site-pi --out PPr.list.sitePivcftools --vcf keep.snpsite.recode.vcf --keep Ptr.list --site-pi --out Ptr.list.sitePi
最后,得到:
- PPr.list.sitePi.log
- PPr.list.sitePi.sites.pi
- Ptr.list.sitePi.log
- Ptr.list.sitePi.sites.pi
- pba.list.sitePi.log
- pba.list.sitePi.sites.pi
- peu.list.sitePi.log
- peu.list.sitePi.sites.pi
将 .pi文件转移到主机上,通过Excel计算平均值。注意,在计算平均值的时候,会出现部分数据为nan的情况,需要在Excel中进行数据过滤。出现nan的原因是有的物种的位点所有的个体都是./.,因此无法计算出结果。
6 计算TajimaD值
使用软件:vcftools
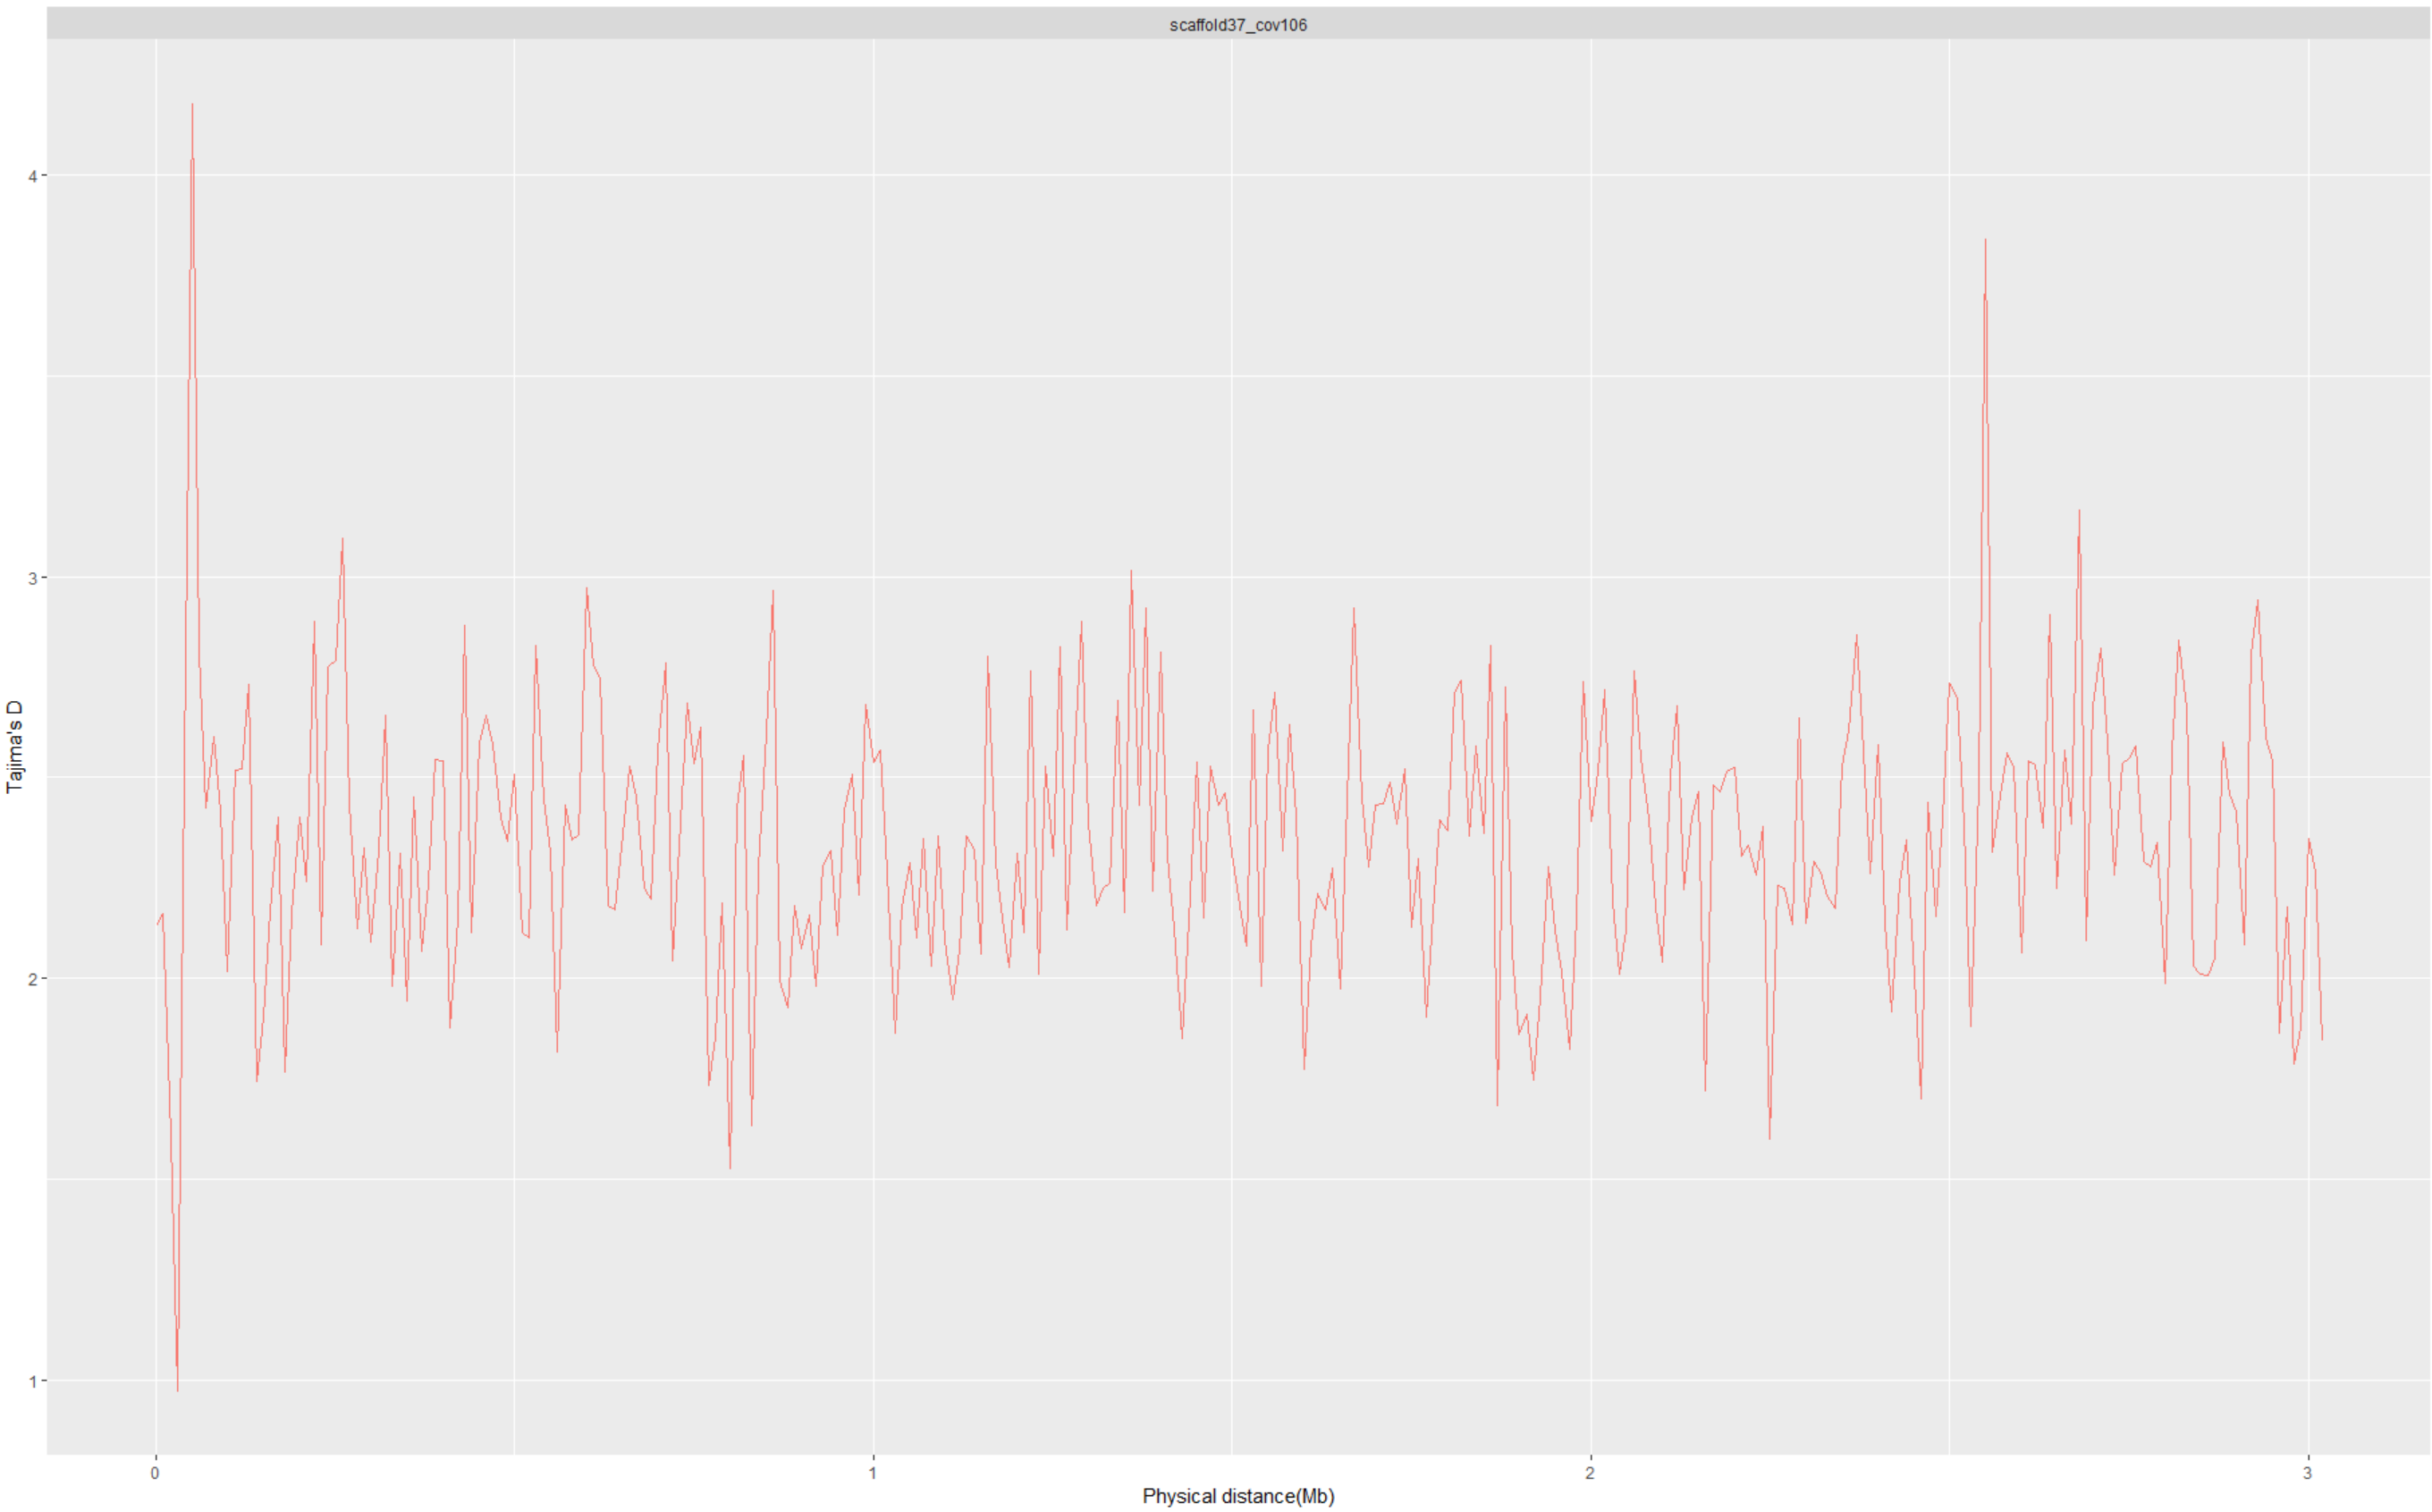
TajimaD值是选择相关的一个参数,大于0代表群体观测杂合度高于预期杂合度,稀有等位基因频率降低(群体收缩或者平衡选择),小于0说明群体观测杂合位点少于预期值,稀有等位基因频率增加(群体扩张或者低频选择)。 也就是说,只有0是正常的,其他都是选择发生。
它主要用来区分一个DNA sequence是random还是non-randon进化的,是不是directional selection。T=0说明没有进行选择,T>0说明sudden population contraction,而<0则说明population expansion after a recent bottleneck。
计算TajimaD值需要指定滑窗大小,这里以size=10000为例。
vcftools --vcf keep.snpsite.recode.vcf --TajimaD 10000 --out keep.snp
得到Tajima.D文件,就是TajimaD值的文件
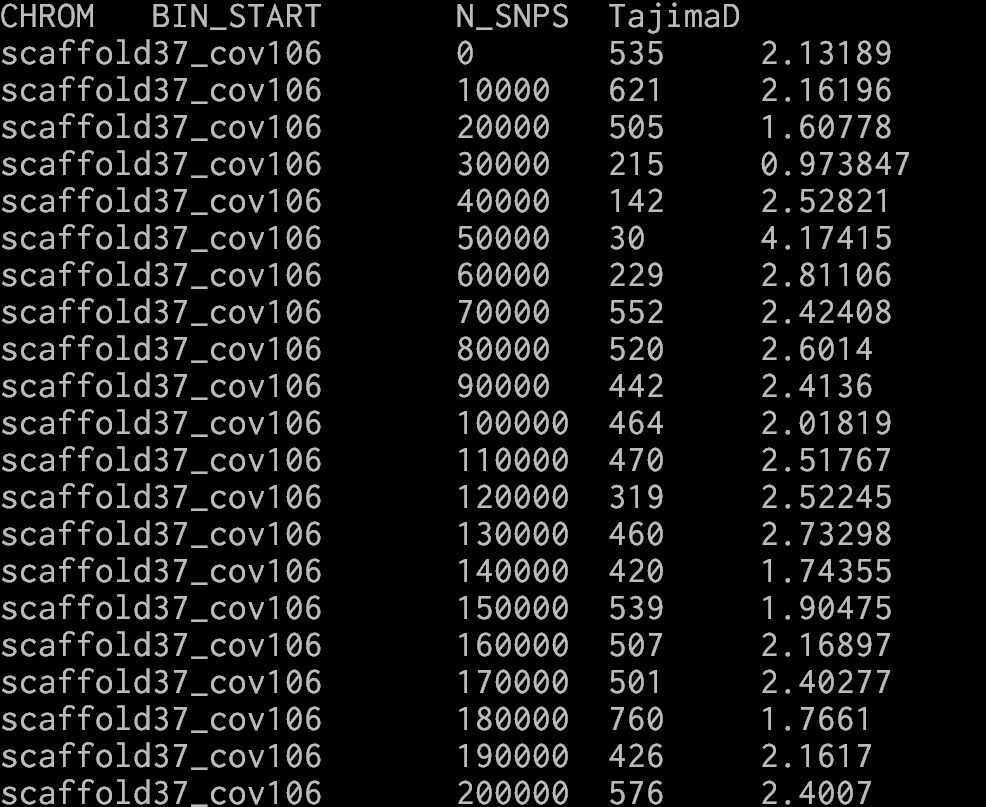
第一列是染色体名称,第二列是滑窗开始的碱基位置,N_SNPS表示滑窗区域内有多少个SNP,TajimaD值就是滑窗内的TajimaD值。
使用R软件对Tajima.D文件画图,表示物种的选择
#TajimaD plotlibrary(ggplot2)mydata<-read.table("C:/Users/mxdwa/Documents/hmc/ComputationalBiologyProject/mt/keep.snp.Tajima.D",header = T)mydata1<-na.omit(mydata)ggplot(mydata1, aes(x=BIN_START/1000000,y=TajimaD,group=factor(CHROM),colour=CHROM))+geom_line()+facet_wrap(mydata1$CHROM)+xlab("Physical distance(Mb)")+ylab("Tajima's D")+theme(legend.position = "none")
画图结果如下:
7 计算SharedSNP
用Python自行写脚本实现功能:
一个个体的位点可能的SNP的值是0/0,0/1或1/1.对于一个物种,只要其中所有个体的总和中出现了1和0,那么就是一个SNP位点;若只有1或者只有0,那么不是SNP位点。
将每个物种的SNP位点保存起来,他们两两共有的SNP就是SharedSNP,该脚本的输出就是两两物种之间SharedSNP的个数。
#CalSharedSNP.pyimport gzipimport sysdef ProcessVcf(vcf_file):#open vcf fileif vcf_file.endswith('.gz'):vcf_fh=gzip.open(vcf_file,'r')else:vcf_fh=open(vcf_file,'r')SNPpos = [[],[],[],[]]# iterate over vcf filefor linenum,line in enumerate(vcf_fh):if line.startswith("##"): # skip headerscontinueline=line.rstrip("\n")# get header lineif line.startswith("#"):header=line.lstrip("#").split("\t")header2index=dict([(h,i) for i,h in enumerate(header)])continue## PPr*10, Ptr*10, pba*10, peu*10 ##tmp=line.split("\t")genotype=[tmp[header2index[name]] for name in header[9:]]#genotype: ['0/1'*indiv_num] for one siteindiv_num = len(genotype)#genotype of each speciesPPrSNP = [SNP[:3] for SNP in genotype[:10]]PtrSNP = [SNP[:3] for SNP in genotype[10:20]]pbaSNP = [SNP[:3] for SNP in genotype[20:30]]peuSNP = [SNP[:3] for SNP in genotype[30:40]]SNPlist = (PPrSNP,PtrSNP,pbaSNP,peuSNP)for index in range(4):static = {'0':0,'1':0,'.':0}for i in SNPlist[index]:i = list(i.split('/'))#print(i,file = f)for j in i:static[j] += 1if static['0'] > 0 and static['1'] > 0:#this is a SNPSNPpos[index].append(tmp[header2index['POS']])return SNPposdef CalSharedSNP(SNPpos,index1,index2):SharedNum = 0for i in SNPpos[index1]:if i in SNPpos[index2]:SharedNum+=1return SharedNumdef main():SNPpos = ProcessVcf("keep.snpsite.recode.vcf")print("SharedSNP between PPr and Ptr",CalSharedSNP(SNPpos,0,1))print("SharedSNP between PPr and Pba",CalSharedSNP(SNPpos,0,2))print("SharedSNP between PPr and Peu",CalSharedSNP(SNPpos,0,3))print("SharedSNP between Ptr and Pba",CalSharedSNP(SNPpos,1,2))print("SharedSNP between Ptr and peu",CalSharedSNP(SNPpos,1,3))print("SharedSNP between pba and peu",CalSharedSNP(SNPpos,2,3))main()
结果如下:
SharedSNP between PPr and Ptr 1582
SharedSNP between PPr and Pba 1469
SharedSNP between PPr and Peu 36250
SharedSNP between Ptr and Pba 13513
SharedSNP between Ptr and peu 1776
SharedSNP between pba and peu 1670
8 计算FST
分化系数,从0到1说明亲缘关系越来越远。接近于0说明两个个体亲缘关系近,接近1说明亲缘关系远。
使用软件:vcftools
Hardy-Weinberg平衡,Tajima's D ,π和Fst检测
计算Fst,Pi,Tajimi'D based on SNP vcf file
由于FST是表示两个物种之间的亲缘关系,因此需要两个物种的信息,生成的结果也是物种两两之间的结果,因此4个物种,两两之间的FST值就有6个。
首先,需要使用物种的列表 (PPr.list ···)来指定个体,然后使用如下命令计算FST值
vcftools --vcf keep.snpsite.recode.vcf --weir-fst-pop Ptr.list --weir-fst-pop PPr.list --out Ptr_vs_PPrvcftools --vcf keep.snpsite.recode.vcf --weir-fst-pop Ptr.list --weir-fst-pop pba.list --out Ptr_vs_pbavcftools --vcf keep.snpsite.recode.vcf --weir-fst-pop Ptr.list --weir-fst-pop peu.list --out Ptr_vs_peuvcftools --vcf keep.snpsite.recode.vcf --weir-fst-pop PPr.list --weir-fst-pop pba.list --out PPr_vs_pbavcftools --vcf keep.snpsite.recode.vcf --weir-fst-pop PPr.list --weir-fst-pop peu.list --out PPr_vs_peuvcftools --vcf keep.snpsite.recode.vcf --weir-fst-pop pba.list --weir-fst-pop peu.list --out pba_vs_peu
生成如下文件;
- Ptr_vs_PPr.weir.fst
- Ptr_vs_pba.weir.fst
- Ptr_vs_peu.weir.fst
- PPr_vs_pba.weir.fst
- PPr_vs_peu.weir.fst
- pba_vs_peu.weir.fst
使用Excel可以计算每个.fst文件的平均FST值
FST也可以限定滑窗window大小--fst-window-size 3000,然后使用和TajimaD值一样的R代码进行画图,画图的结果也相似。
9 连锁平衡 linkage disequilibrium (LD)
使用软件:plink和vcftools都可以,使用vcftools效果更好一些。
#plinkplink --vcf keep.snpsite.recode.vcf --r2 --ld-window-kb 100 --ld-window-r2 0 --out keep.snpsite.recode --allow-extra-chr#vcftoolsvcftools --vcf PPr.snpsite.recode.vcf --geno-r2 --ld-window-bp 100000 --maf 0.05 --max-missing-count 4 --out PPr.snpdite.recode
其中,--geno-r2表示计算值,--ld-window-bp表示滑窗大小为100000bp,即100kb,--maf 0.05表示最大missing ratio为5%,最大missing count为4。
生成了相应的.ld文件,如图
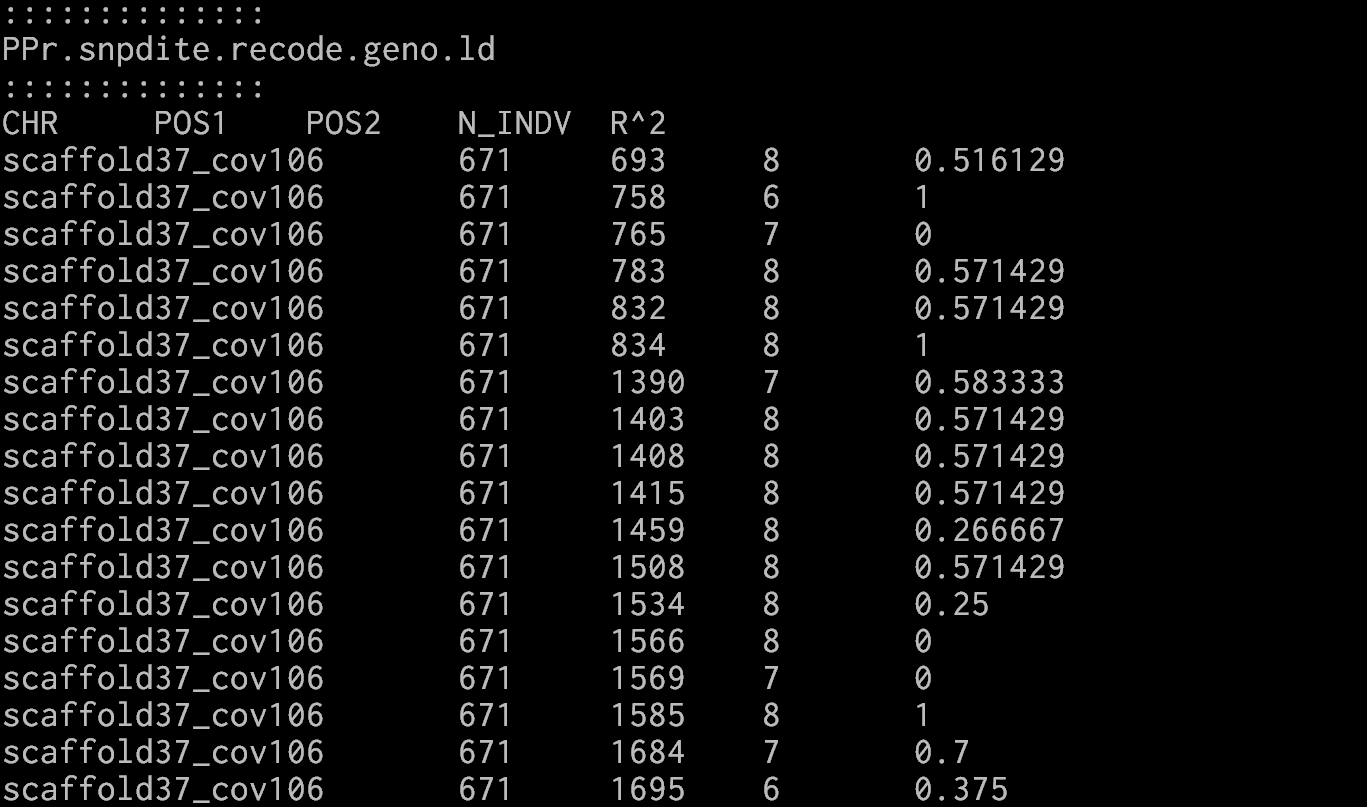
其中值就表示了LD。
LD结果可以使用Excel画图,横坐标是POS2和POS1的差,纵坐标是绘制散点图。
参考链接:
vcftools官网
vcftools用法
