@77qingliu
2018-05-13T12:06:00.000000Z
字数 12756
阅读 2360
预测力指标
信用评分
这里继续探讨EDA过程,并重点介绍对候选变量预测力的判断。
首先明确区分相关性和关联性的区别。统计学上,相关性通常指的变量之间的线性相关,而其他所有的非线性相关都可以用关联性来衡量。
需要衡量变量间相关性和关联性的原因有以下几点:
- 由于logistic回归的限制,模型中预测变量间不能具有很强的相关性,或者最好不存在相关性。
- 强相关性会使得模型的可解释性变弱
而通过判断变量之间的相关水平,可以过滤掉预测力低的变量。接下来,讨论这些衡量指标和他们的SAS实现过程
符号
不同的相关性和关联性指标需要使用大量符号。
| 指标 | 描述 | 指标 | 描述 |
|---|---|---|---|
| 皮尔逊卡方统计量 | 似然比 | ||
| 皮尔逊相关系数 | 似然比检验统计量 | ||
| 斯皮尔曼相关系数 | 熵方差 | ||
| 基尼方差 | 信息值 |
根据变量类型,这些符号可以分为3组:
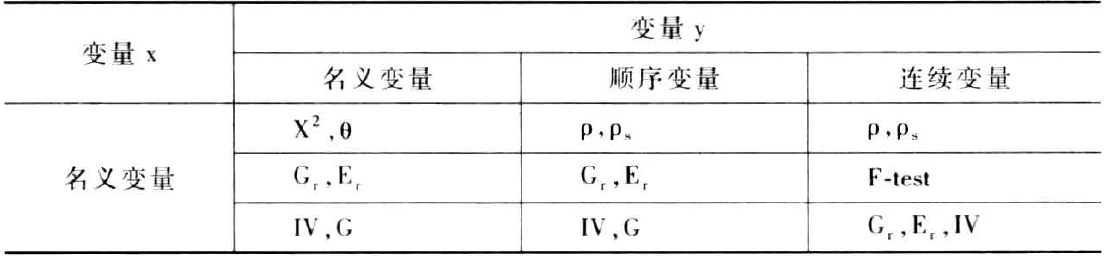
皮尔逊相关系数
给定两个连续变量和,皮尔逊相关系数被定义为:
的取值总是在0-1之间,接近0表示变量间无相关性,接近1表示强相关性。
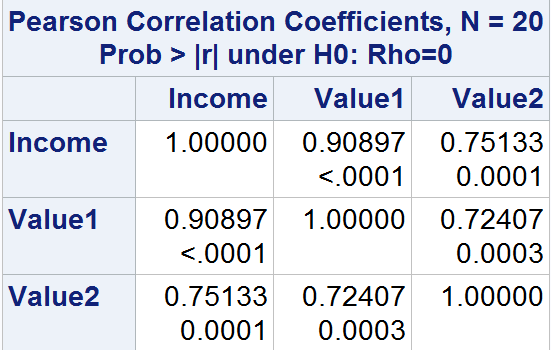
proc corr可以计算多个相关系数,皮尔逊相关是默认指标。如下例所示:
程序
data Homes;input Income Value1 Value2 @@;datalines;20 120 120 22 165 165 25 203 20325 205 205 31 192 192 33 220 22036 129 129 36 269 269 37 136 13640 364 364 48 194 759 52 285 28555 279 279 59 320 320 64 370 37081 448 448 83 514 514 98 419 41999 613 613 99 526 667;run;/* Calculate the Person correlation coefficient usingPROC FREQ */proc corr data=Homes pearson;var Income Value1 Value2;run;
输出
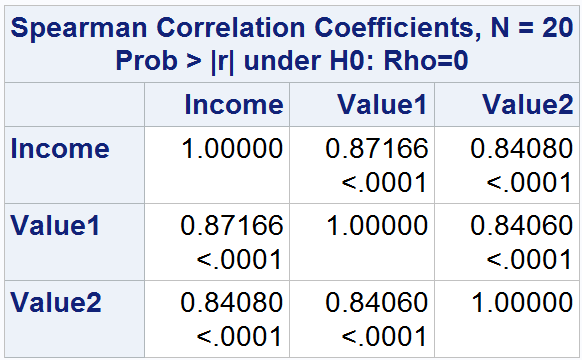
斯皮尔曼相关系数
斯皮尔曼相关系数采用的是取值的等级,而不是取值本身,常用作顺序变量的相关性检验。例如,给定3个值:33,21,44,他们的等级就是2,1,3。具体的计算公式如下:
其中R和S分布代表观测i取值的等级。可以用
proc corr通过指定选项spearman来计算斯皮尔曼相关系数。举例如下: 程序
data Homes;input Income Value1 Value2 @@;datalines;20 120 120 22 165 165 25 203 20325 205 205 31 192 192 33 220 22036 129 129 36 269 269 37 136 13640 364 364 48 194 759 52 285 28555 279 279 59 320 320 64 370 37081 448 448 83 514 514 98 419 41999 613 613 99 526 667;run;proc corr data=Homes spearman;var Income Value1 Value2;run;
输出
另外,在proc corr中,可以指定outp=ocorr或者outs=scorr将皮尔逊或者斯皮尔曼相关系数输出到数据集中。
proc corr data=Homes Pearson Spearman OutP=PCorr OutS=SCorr;var Value1 Value2 Income;run;
皮尔逊卡方统计量
皮尔逊卡方统计量,用表示,用来衡量两个分类变量之间的关联性。公式如下:
其中
表示计算第i行和第j列中的预期单元数。
如果单元数很大,服从自由度为的卡方分布。因此,独立性概率为:
皮尔逊卡方值可以在
proc freq中,通过在tables语句中指定选项chisq计算得到。举例如下: 程序
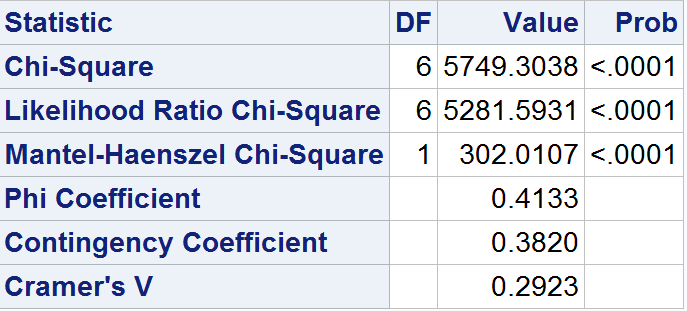
data CreditApp;length ResidenceCat $20.;length EmploymentCat $20.;infile datalines delimiter=',';input ResidenceCat $ EmploymentCat $ Wt ;datalines;House,Full time,6248House,Part time,4215House,Self employed,4521House,Other,857Apartment,Full time,4128Apartment,Part time,3874Apartment,Self employed,1125Apartment,Other,741Other,Full time,3145Other,Part time,1780Other,Self employed,452Other,Other,2569;run;/* Calculate the Pearson Chi-squared statistic usingPROC FREQ */proc freq data = CreditApp order=data;tables ResidenceCat * EmploymentCat/CHISQ;weight wt;run;
输出
似然比
似然比检验统计量,用表示,是基于最大似然估计原理(MLE)的统计量。MLE的原理是定义一个似然函数,赋予其所需求的解的特征。
首先,从观测一个有类,分布为的名义变量的简单案例开始。假设来自一个已知分布的总体,因其各类的概率定为,表示为向量
然后,抽取一个规模为N的样本。该样本的每一类别的概率表示为,将其表示为向量。这些类别观察到的频率是。
对于当前样本,写出其似然函数以代表得到的类别的联合概率为:
由于一直当前样本中各类别的真实概率,可以计算其概率为
因而,似然函数可以表示为:
对已知概率总体的似然函数的估计表示如下:
似然比定义为检验对于任意的假设的统计量。该比率统计量可以定义为:
最后,定义似然比统计量,用表示,为。可以得到:
还可以表示成另外一个有用的格式:
服从的渐进卡方分布。
在
proc freq可输出似然比卡方统计量。概率比
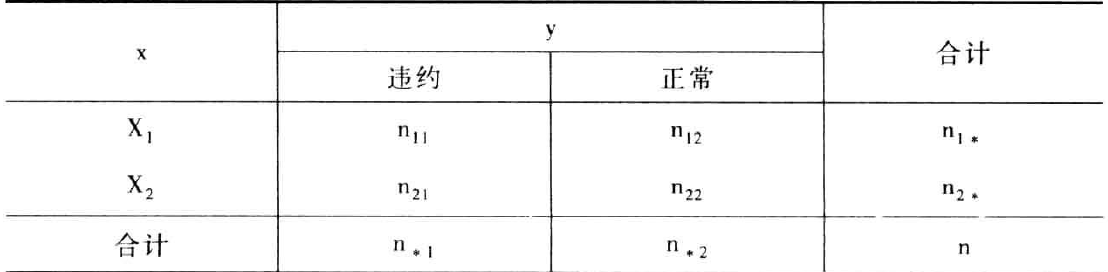
如果两个变量都是二元的,即二分类的,见下表
概率比,用表示:
如果概率比接近1,则表明变量x相对于变量y的频率分布不存在差异。
可以在
proc freq中应用选项measures计算概率比,如下例所示: 程序
data CreditCards ;input Region $ Status $ Wt;datalines;Europe Bad 3425US Bad 3719Europe Good 71254US Good 69845;run;/* Calculate the odds ratio using PROC FREQ */proc Freq Data=CreditCards order=data;table Region * Status/measures chisq;WEIGHT Wt;run;
输出
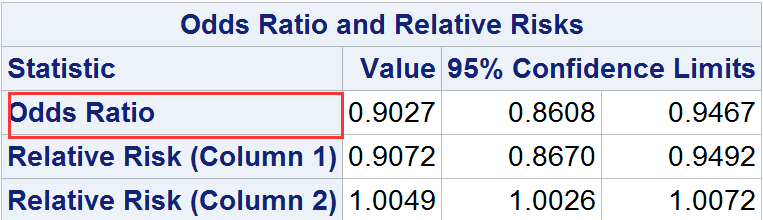
大多数情况下,概率比的结果还能得到皮尔逊卡方统计量和似然比统计量相似结论的支持。
概率比在logistc模型中起到关键作用。
最常见的logistic回归模型是:
odds是状态变量违约-正常的比率。
考虑到模型只有唯一二元自变量的情况,这种情况下,logistic回归模型可以简化为
将变量x=1,0的值代入模型,得到
这两个等式相减,可以得到变量对违约-正常的比率的影响:
主要到即为概率比,因而,可以将概率比用模型的参数表示:
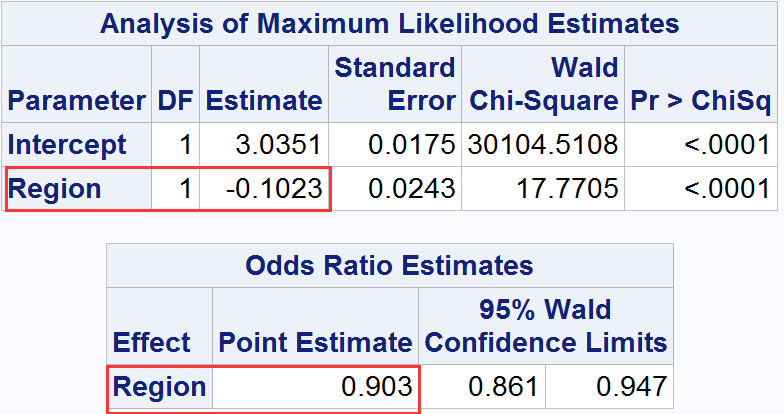
下例程序用logistic模型计算概率比:
data CreditCards ;input Region Status Wt;datalines;0 1 34251 1 37190 0 712541 0 69845;run;/* Invoke logistic regression */proc logistic Data=CreditCards;model Status (event='0')=Region;WEIGHT Wt;run;
输出
F检验
F检验衡量一个名义变量和一个连续变量之间的关联性。其中,谁是因变量不重要。公式如下:
其中,组间方差定义为:
其中, 表示第i组的均值, 表示第i组的观测数 表示总的均值, 表示分组数目.
组内方差定义为:
其中 是第j组的第i个观测, 是总的观测数.,
的值是自由度的累积分布的逆。即
宏CalcGrF可执行F检验
基尼方差
基尼方差被定义为,衡量三种情况下变量之间关联性的指标:
- 一个连续变量和一个名义变量或者顺序变量
- 两个名义变量
- 两个顺序变量
首先一个连续变量和一个名义变量的情况,基尼方差可以定义为:
宏%ClacGrF可以计算基尼方差和F值以及p值。宏的参数如下表
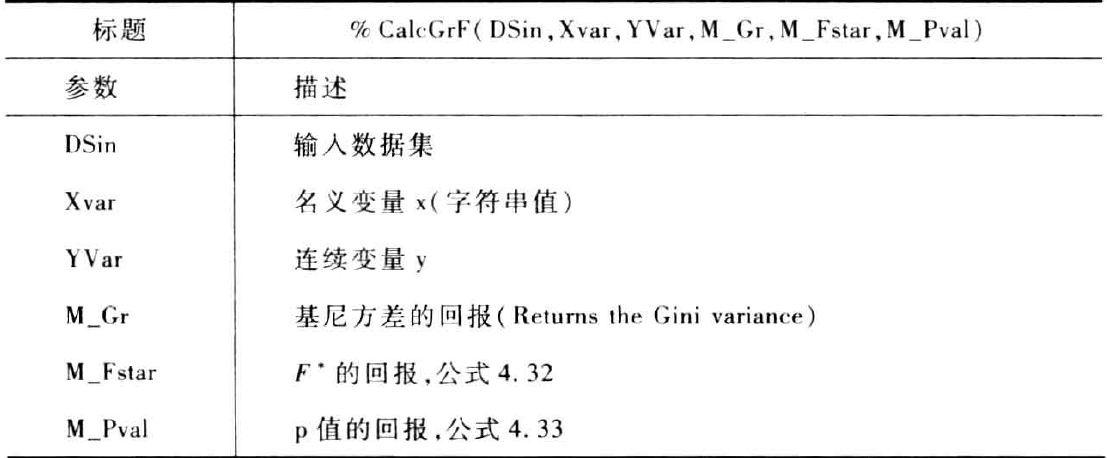
下列示例用来计算基尼方差
data CC;input Default $ AvgBalance @@;datalines;N 1132.37 N 1118.39 Y 336.17 N 775.64 N 519.49N 303.34 N 1418.00 N 1372.85 N 1363.32 N 244.29N 624.70 N 1191.22 N 1536.35 N 752.05 N 1013.60N 1394.93 N 688.43 N 557.26 N 773.99 N 1302.07N 1241.23 N 765.49 N 775.11 N 683.23 N 922.97N 1095.69 N 752.59 N 1488.18 N 687.98 N 901.57N 1761.56 N 861.63 N 1095.73 N 1626.03 N 498.24N 1139.91 N 1524.18 N 387.17 N 1313.15 N 1155.98N 727.66 N 689.59 N 1577.18 N 1522.56 Y 225.92Y 279.63 N 261.39 N 874.46 N 1352.64 N 1898.72N 622.42 N 1791.32 N 1497.03 N 913.54 N 861.12Y 539.82 N 886.68 N 499.23 N 942.35 N 515.34Y 462.33 N 1618.78 N 1392.00 N 1113.60 N 765.68N 1119.53 N 906.02 N 884.23 N 901.92 Y 556.98N 633.66 N 343.12 N 1036.54 N 498.94 Y 238.26Y 19.41 N 1492.44 N 545.95 N 1776.19 N 1048.82N 1270.68 N 897.63 N 1194.00 N 422.45 N 500.44N 1602.12 N 1135.93 N 900.85 Y 134.19 N 598.06N 1009.30 N 618.23 N 1855.87 N 1074.82 Y 401.79N 1139.86 N 568.81 N 913.48 N 1470.60 N 1468.44;run;/* Call the macro: the variables in the macro headerwith the prefix M_ are to be initialized to nullstrings before calling the macro */%let DSin=CC;%let Xvar=default;%let YVar=AvgBalance;%let Gr=;%let Fstar=;%let Pvalue=;%CalcGrF(&DSin, &Xvar, &YVar, Gr, Fstar, Pvalue);/* output the values to the SAS-Log window */%put Gr=&Gr Fstar=&Fstar Pvalue=&Pvalue;
输出

现在考虑x和y都是名义变量,或都是顺序变量的情况。基尼方差可以用以下定义:
其中,
且
使用宏%GNomNom可以计算两个名义变量的基尼方差,宏的参数如下
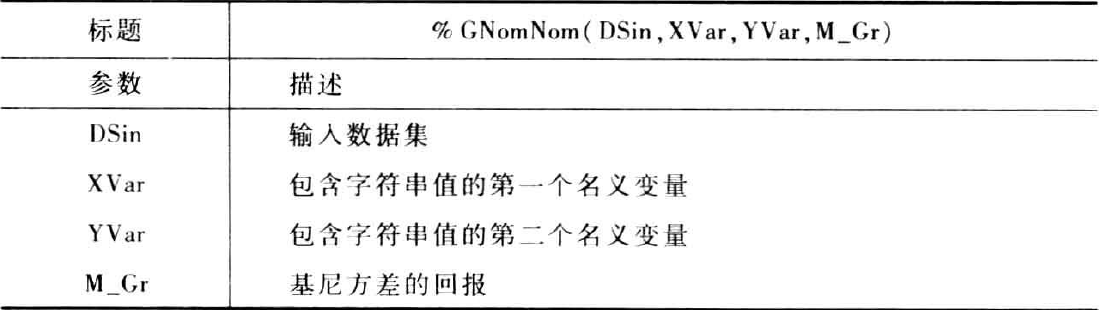
示例如下
data Home_Emp1;length ResidenceCat $20.;length EmploymentCat $20.;infile datalines delimiter=',';input ResidenceCat $ EmploymentCat $ FR ;datalines;House,Full time,248House,Part time,215House,Self employed,121House,Other,157Apartment,Full time,98Apartment,Part time,74Apartment,Self employed,25Apartment,Other,141Other,Full time,145Other,Part time,80Other,Self employed,82Other,Other,69;run;DATA Home_Emp2;set Home_Emp1;do i=1 to FR;output;end;drop i FR;run;/* Call the macro */%let DSin=Home_Emp2;%let XVar=ResidenceCat;%let YVar=EmploymentCat;%let Grx1=;%GNomNom(&DSin, &XVar, &YVar, Grx1);/* Display the Gini variance in the SAS Log */%put GR=&Grx1;/* Interchange the variables */%let DSin=Home_Emp2;%let XVar=EmploymentCat;%let YVar=ResidenceCat;%let Grx2=;%GNomNom(&DSin, &XVar, &YVar, Grx2);%put GR=&Grx2;
输出

熵方差
首先一个连续变量和一个名义变量的情况,熵方差可以定义为:
可以看出,公式与基尼方差相同
当x和y都是名义变量时,熵方差可以定义为:
其中,
且
宏%ENomNom可以计算两个名义变量的熵方差。宏的参数如下
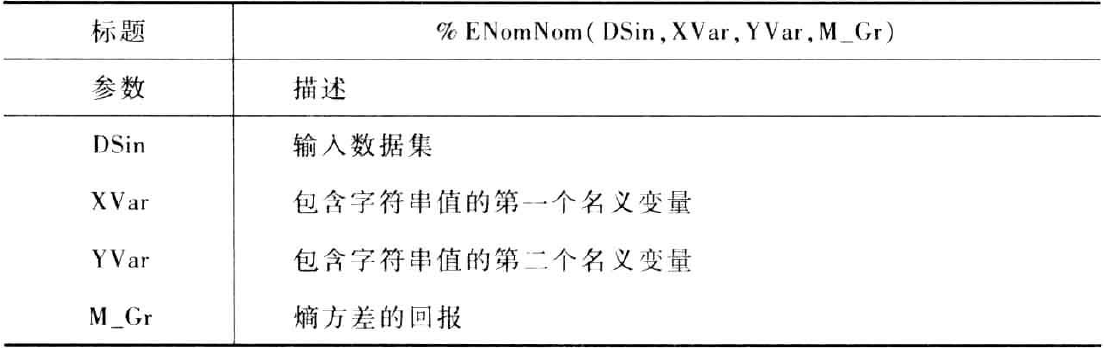
示例
data Home_Emp1;length ResidenceCat $20.;length EmploymentCat $20.;infile datalines delimiter=',';input ResidenceCat $ EmploymentCat $ FR ;datalines;House,Full time,248House,Part time,215House,Self employed,121House,Other,157Apartment,Full time,98Apartment,Part time,74Apartment,Self employed,25Apartment,Other,141Other,Full time,145Other,Part time,80Other,Self employed,82Other,Other,69;run;DATA Home_Emp2;set Home_Emp1;do i=1 to FR;output;end;drop i FR;run;/* Call the macro */%let DSin=Home_Emp2;%let XVar=ResidenceCat;%let YVar=EmploymentCat;%let Erx1=;%ENomNom(&Dsin, &Xvar, &YVar, Erx1);/* Display the Entropy variance in the SAS Log */%put ER=&Erx1;/* Interchanging the variables */%let DSin=Home_Emp2;%let XVar=EmploymentCat;%let YVar=ResidenceCat;%let Erx2=;%ENomNom(&Dsin, &Xvar, &YVar, Erx2);%put ER=&Erx2;
输出

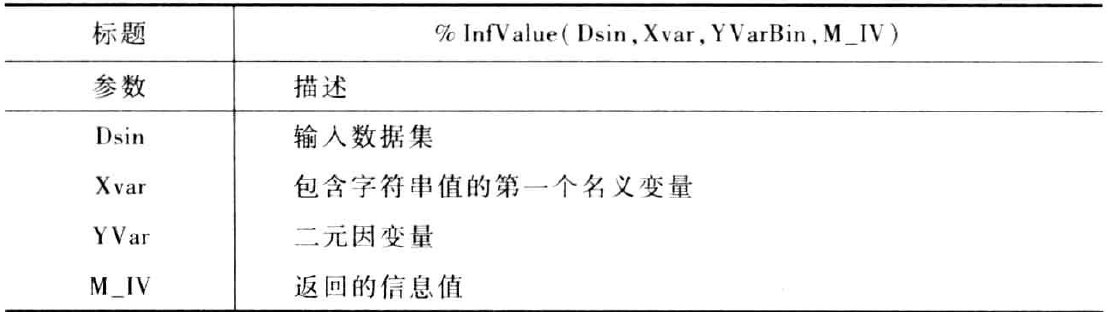
信息值
信息值,是衡量两个名义变量,其中一个是二元变量,之间关联性的指标。信息值可以定义为:
或者也可以定义为
其中和分布是第i行中变量第1类和第2类中记录的百分比。
信息值的定义仅针对二元变量和名义变量。因此,将其应用到一个顺序变量时,顺序关系将被忽略。如果是连续变量,该变量被分段。
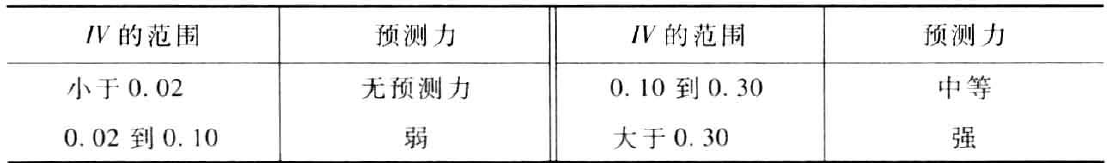
在上述的基础上,当前信用评分开发实践中,提供了用信息值决定候选变量的预测里的一般准则。见下表:
宏%InfValue可用来计算信息值,参数列表如下
变量选择自动化
上面已经介绍了几个衡量变量间关联性和相关性的统计量。这些衡量指标或者用于判断候选自变量的预测里,或者用于评估自变量之间的关联性。上述任何一项工作,都需要一个自动计算不同衡量指标的程序。这里将介绍实施这种自动变量选择的SAS宏。
这里假设所有自变量都是同一种类型,即全部都是名义变量、顺序变量或连续变量,没有多种类型变量混杂的情况。宏%PowerGini用基尼方差计算一系列变量的预测力,其生成的值存储在一个数据集中。其参数列表如下:
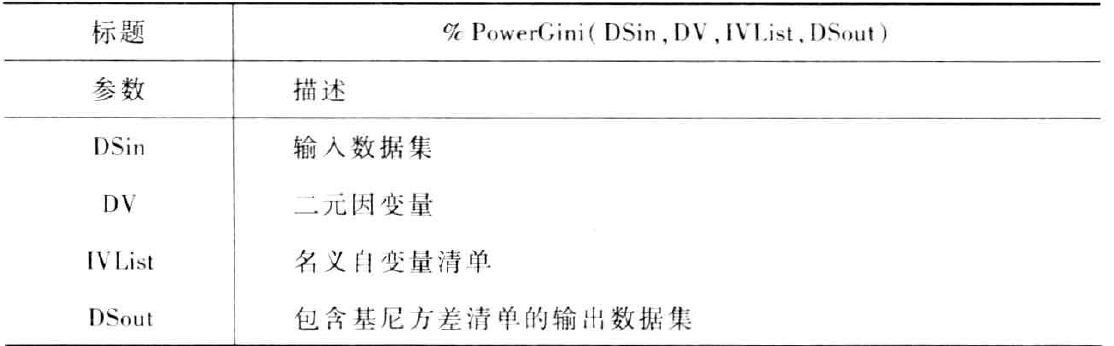
基本上,宏可以被分成以下三个部分:
- 第一部分,将变量名称的清单,IVList,分解成单个的标识并将其存储为宏变量
- 用宏
%GNomBin对这些变量进行循环操作,计算基尼方差的值。通过使用proc sql的insert语句将计算的每个基尼方差存储在输出数据集中 - 最后,宏将基尼方差按照降序排列,以方便找出最具预测力的变量。
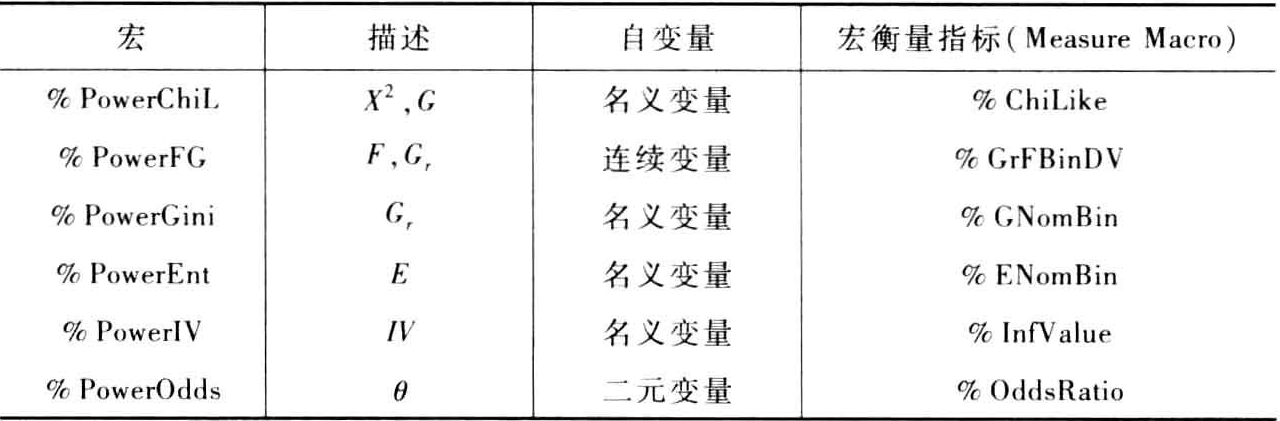
计算关联性指标不是基尼方法,如熵方差或信息值,只需要调用适当的宏对第二个步骤进行调整。
下表列出了所有判断预测力的宏
现在,介绍另外一个宏ExtractTop,该宏读取上表中宏生成的数据集,并从中提取预测力最强的变量。通常,通过指定预期的预测力最强的变量数,或指定衡量指标的最小允许值,实现上述目标。其参数见下表
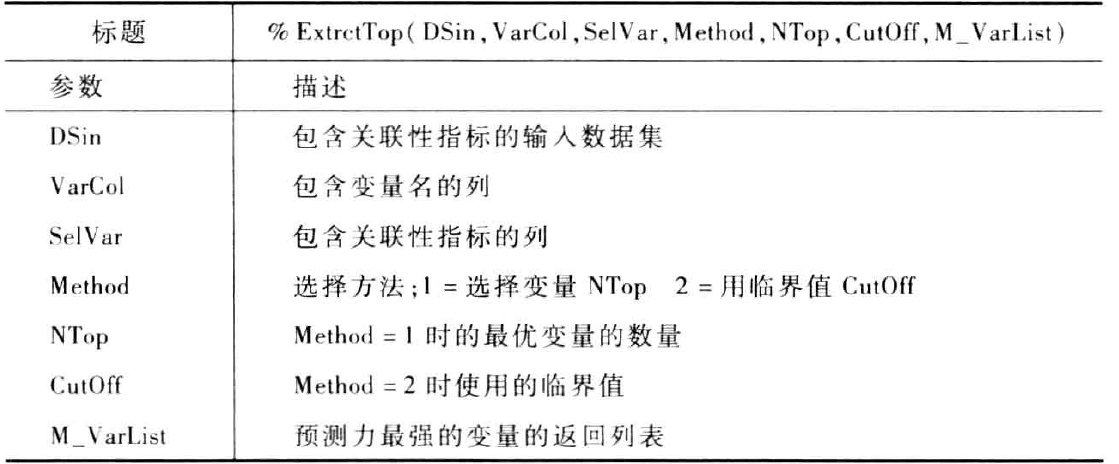
下面举个例子应用ExtractTop提取预测力最强的变量。
程序
data CardInfo1;length EmpType $10.; /* Applicant employment type*/length Gender $6.; /* Applicant Gender */length ResType $10.; /* Applicant Residential status */length AppChannel $10.; /* Application channel */length TelType $10.; /* Type of contact tel number */infile datalines delimiter=',';input EmpType $ Gender $ ResType $ AppChannel $ TelType $ Status Freq;datalines;Full Time,Female,Home owner,Web,Home,1,35Full Time,Female,Home owner,Web,Home,0,9Full Time,Female,Home owner,Web,Mobile,1,18Full Time,Female,Home owner,Web,Mobile,0,6Full Time,Female,Home owner,Mail,Home,1,9Full Time,Female,Home owner,Mail,Home,0,19Full Time,Female,Home owner,Mail,Mobile,1,33Full Time,Female,Home owner,Mail,Mobile,0,28Full Time,Female,Tenant,Web,Home,1,8Full Time,Female,Tenant,Web,Home,0,22Full Time,Female,Tenant,Web,Mobile,1,25Full Time,Female,Tenant,Web,Mobile,0,31Full Time,Female,Tenant,Mail,Home,1,37Full Time,Female,Tenant,Mail,Home,0,18Full Time,Female,Tenant,Mail,Mobile,1,26Full Time,Female,Tenant,Mail,Mobile,0,28Full Time,Male,Home owner,Web,Home,1,12Full Time,Male,Home owner,Web,Home,0,36Full Time,Male,Home owner,Web,Mobile,1,2Full Time,Male,Home owner,Web,Mobile,0,22Full Time,Male,Home owner,Mail,Home,1,34Full Time,Male,Home owner,Mail,Home,0,27Full Time,Male,Home owner,Mail,Mobile,1,2Full Time,Male,Home owner,Mail,Mobile,0,21Full Time,Male,Tenant,Web,Home,1,32Full Time,Male,Tenant,Web,Home,0,33Full Time,Male,Tenant,Web,Mobile,1,1Full Time,Male,Tenant,Web,Mobile,0,8Full Time,Male,Tenant,Mail,Home,1,17Full Time,Male,Tenant,Mail,Home,0,15Full Time,Male,Tenant,Mail,Mobile,1,10Full Time,Male,Tenant,Mail,Mobile,0,24Other,Female,Home owner,Web,Home,1,21Other,Female,Home owner,Web,Home,0,39Other,Female,Home owner,Web,Mobile,1,28Other,Female,Home owner,Web,Mobile,0,17Other,Female,Home owner,Mail,Home,1,23Other,Female,Home owner,Mail,Home,0,11Other,Female,Home owner,Mail,Mobile,1,34Other,Female,Home owner,Mail,Mobile,0,3Other,Female,Tenant,Web,Home,1,21Other,Female,Tenant,Web,Home,0,31Other,Female,Tenant,Web,Mobile,1,18Other,Female,Tenant,Web,Mobile,0,28Other,Female,Tenant,Mail,Home,1,27Other,Female,Tenant,Mail,Home,0,32Other,Female,Tenant,Mail,Mobile,1,16Other,Female,Tenant,Mail,Mobile,0,24Other,Male,Home owner,Web,Home,1,11Other,Male,Home owner,Web,Home,0,26Other,Male,Home owner,Web,Mobile,1,19Other,Male,Home owner,Web,Mobile,0,1Other,Male,Home owner,Mail,Home,1,31Other,Male,Home owner,Mail,Home,0,14Other,Male,Home owner,Mail,Mobile,1,17Other,Male,Home owner,Mail,Mobile,0,19Other,Male,Tenant,Web,Home,1,35Other,Male,Tenant,Web,Home,0,23Other,Male,Tenant,Web,Mobile,1,12Other,Male,Tenant,Web,Mobile,0,17Other,Male,Tenant,Mail,Home,1,15Other,Male,Tenant,Mail,Home,0,14Other,Male,Tenant,Mail,Mobile,1,9Other,Male,Tenant,Mail,Mobile,0,22;run;/* Use the Freq field to generate the data */DATA CardInfo2;set CardInfo1;do i=1 to Freq;output;end;drop i Freq;run;/* Call the macro */%let DSin=CardInfo2;%let DV=Status;%let IVList=EmpType Gender ResType AppChannel TelType;%let DSOut=CardInfo_IVs;%PowerIV(&DSin, &DV, &IVList, &DSout);/* Extract the top three variables */%let DSin=CardInfo_IVs;%let VarCol=VariableName;%let SelVar=InformationValue;%let Method=1;%let Ntop=3;%let Cutoff=0;%let VarList=;%ExtrctTop(&DSin, &VarCol, &SelVar, &Method, &NTop, &CutOff, VarList);%put Selected Variables: &VarList;/* Extract the top variables with IV>=0.015*/%let DSin=CardInfo_IVs;%let VarCol=VariableName;%let SelVar=InformationValue;%let Method=2;%let Ntop=0;%let Cutoff=0.015;%let VarList=;%ExtrctTop(&DSin, &VarCol, &SelVar, &Method, &NTop, &CutOff, VarList);%put Selected Variables: &VarList;
输出

