@adonia
2016-07-22T08:46:21.000000Z
字数 3972
阅读 862
influxdb+collectd+grafana构建监控系统
运维
说明:测试环境为
centos 6.8
influxdb
安装
- curl -o influxdb.tar.gz https://dl.influxdata.com/influxdb/releases/influxdb-0.13.0_linux_amd64.tar.gz
- tar xzvf influxdb.tar.gz
或者使用docker镜像,执行docker pull influxdb。(influxdb对接collectd时,需要开启udp端口,待验证)
解压之后,influxdb的安装目录内容如下:
├── etc│ ├── influxdb│ │ ├── influxdb.conf│ │ └── influxdb.conf.template│ └── logrotate.d│ └── influxdb├── usr│ ├── bin│ │ ├── influx│ │ ├── influxd│ │ ├── influx_inspect│ │ ├── influx_stress│ │ └── influx_tsm│ └── lib│ └── influxdb│ └── scripts│ ├── influxdb.service│ └── init.sh└── var├── lib│ └── influxdb└── log└── influxdb
其中,usr/bin/influxd为influxdb的引导程序;etc/influxdb/influxdb.conf为配置文件。
配置
Tips: 在修改
etc/influxdb/influxdb.conf配置之前,先备份一份。
需要注意的是influxdb的三部分配置---admin、http和collectd,分别是influxdb管理控制台、HTTP API以及对接collectd的配置。其中可以保持admin和http的配置不动。
Tips:
admin和http使用的端口分别是8083和8086,只要保证端口不冲突即可。
对接collectd的默认配置如下:
[[collectd]]enabled = false# bind-address = ""# database = ""# typesdb = ""# These next lines control how batching works. You should have this enabled# otherwise you could get dropped metrics or poor performance. Batching# will buffer points in memory if you have many coming in.# batch-size = 1000 # will flush if this many points get buffered# batch-pending = 5 # number of batches that may be pending in memory# batch-timeout = "1s" # will flush at least this often even if we haven't hit buffer limit# read-buffer = 0 # UDP Read buffer size, 0 means OS default. UDP listener will fail if set above OS max.
将其修改为:
[[collectd]]enabled = truebind-address = ":25826"database = "collectd"# typesdb = ""# These next lines control how batching works. You should have this enabled# otherwise you could get dropped metrics or poor performance. Batching# will buffer points in memory if you have many coming in.# batch-size = 1000 # will flush if this many points get buffered# batch-pending = 5 # number of batches that may be pending in memory# batch-timeout = "1s" # will flush at least this often even if we haven't hit buffer limit# read-buffer = 0 # UDP Read buffer size, 0 means OS default. UDP listener will fail if set above OS max.
- 将
[collectd][enabled]置为true;- 设置对接
collectd的udp端口为25826;- 设置
influxdb中存储collectd数据的数据库为collectd。
启动
在influxdb的安装目录下执行:
./usr/bin/influxd run -config /opt/influxdb/etc/influxdb/influxdb.conf
/opt/influxdb为influxdb的安装目录,注意替换成实际目录。
或者执行如下命令,将influxd作为后台程序启动:
nohup /opt/influxdb/usr/bin/influxd run -config /opt/influxdb/etc/influxdb/influxdb.conf &
启动之后,查看有无错误日志。
验证
在influxdb对接collectd的配置后,在启动influxdb时,会自动创建collectd数据库。
可通过influxdb的管理控制台或者RESTful接口查询其中的数据库来验证。
- 访问管理控制台,
192.168.102.16:8083,在Query中输入查询语句---show databases - 通过Restful接口---
GET 192.168.102.16:8086/query?pretty=true&q=show databases
查询结果应如下:
{"results": [{"series": [{"name": "databases","columns": ["name"],"values": [["_internal"],["graphite"],["collectd"]]}]}]}
collectd
安装
参考collectd安装。
配置
修改/etc/collectd.conf,如下:
Hostname "localhost"LoadPlugin interfaceLoadPlugin cpuLoadPlugin memoryLoadPlugin networkLoadPlugin df<Plugin interface>Interface "eth0"IgnoreSelected false</Plugin><Plugin network><Server "192.168.102.16" "25826"></Server></Plugin>
25826即为collectd上报数据的udp端口,与influxdb中配置的保持一致。
保存,执行service collectd restart,重启collectd。
验证
启动完成之后,collectd会定期收集操作系统的数据,之后,将数据上报至influxdb中。
在influxdb的管理控制台---192.168.102.16:8083的菜单栏的Database下拉栏中选择collectd,在Query输入下述查询语句:
show measurements--- 查询collectd数据库中的表,结果如下: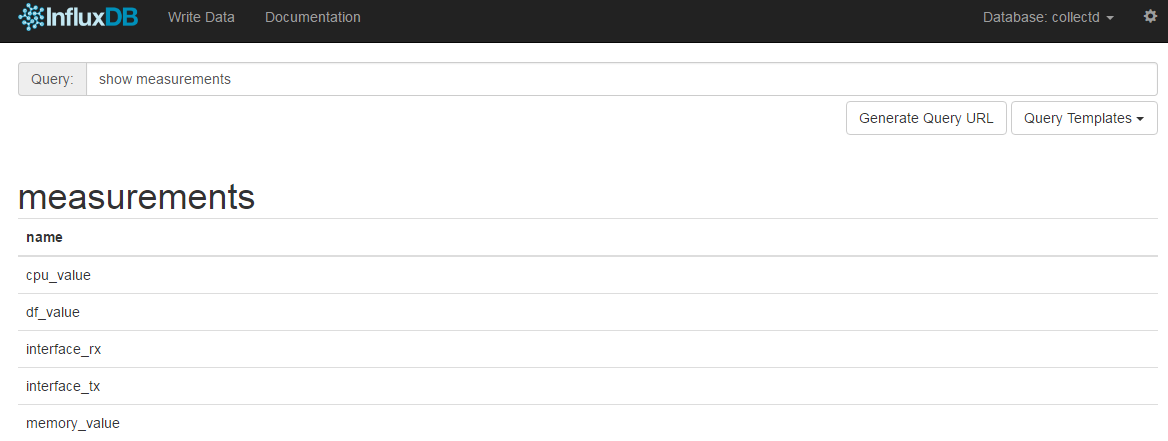
select * from cpu_value--- 查询cpu使用信息
grafana
安装
通过docker镜像的方式安装grafana:
docker pull grafana/grafanadocker run -d -p 3000:3000 grafana/grafana
grafana对外暴露的端口是3000,启动时,指定VM的端口与其对应。
设置
访问192.168.102.16:3000,默认账号是 admin/admin。
- 对接
influxdb数据库
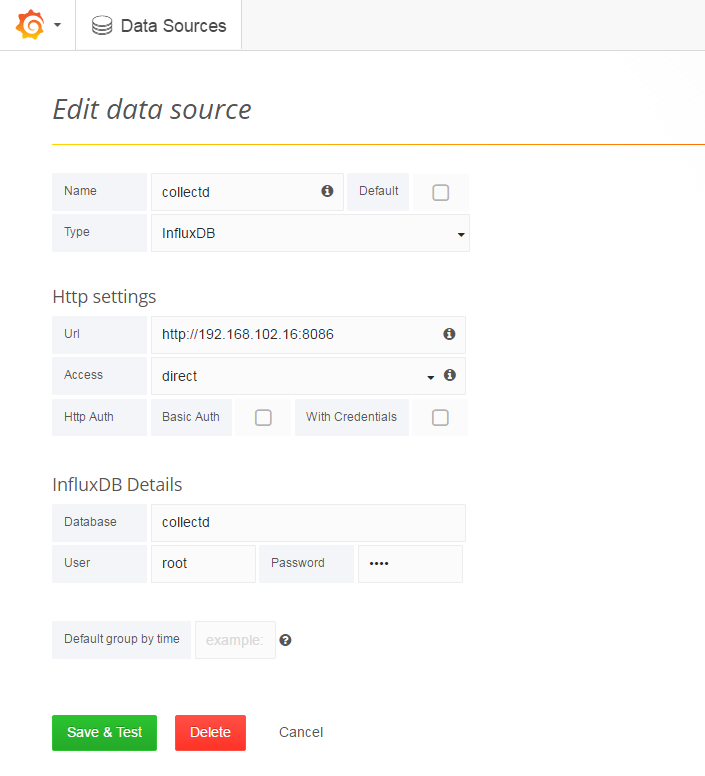
在左侧菜单栏中选择Data Sources--->Add data source,如下:
Tips:
- 在
InfluxDB Details指定Database为collectd,User为默认的root/root。
- 绘制数据图表
下面将collectd数据库中的cpu_value、df_value和memory_value的数据绘制成数据图表。
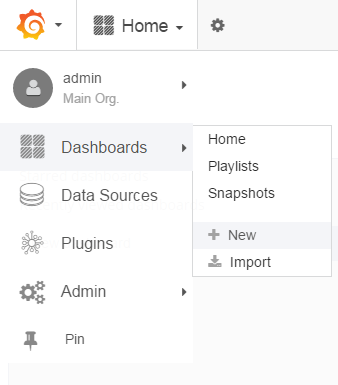
1) 首先,选择+ New,新建Dashboard,如下:
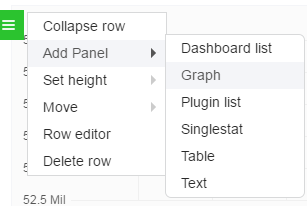
2) 在新建的Dashboard页面,点击+ADD ROW,在左侧选择新建Graph,如下:
之后,新创建的Graph页面如下:

会有个默认数据图表,点击右侧的 删除。
删除。
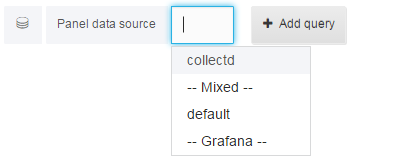
3) 在Panel data source中选择collectd数据库,点击+ Add Query添加查询语句,如下:
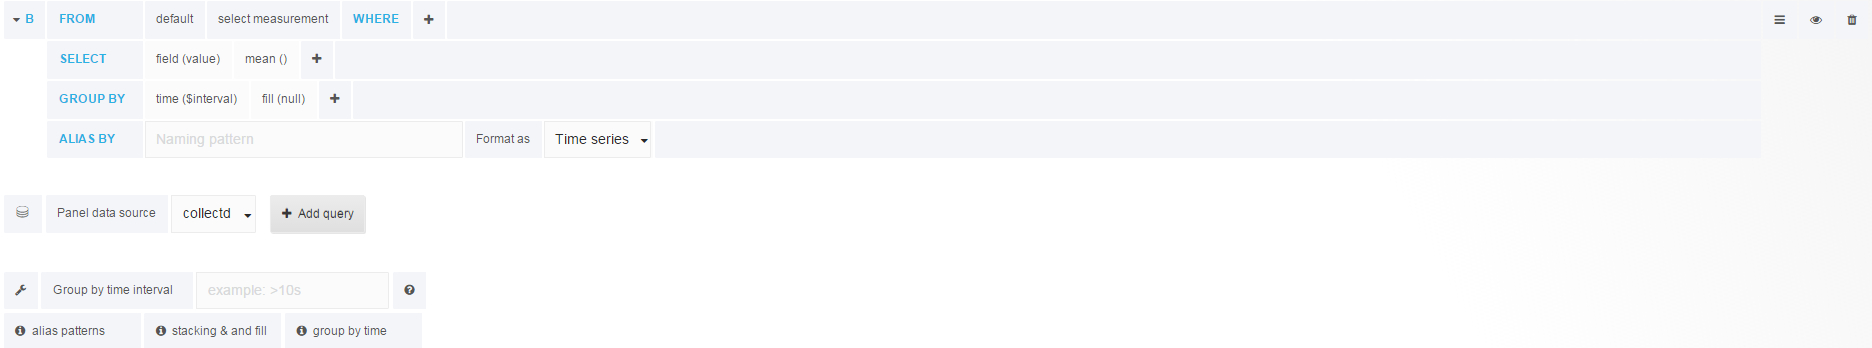
比如,需要展示剩余的CPU,对应的数据库查询语句为select value from cpu_value where type_instance = 'idle' and type = 'cpu'。
select measurement选择cpu_value点击
where后的+增加过滤语句点击第二行(
SELECT)的mean()上方位置,会出现x,将其删除同样操作,将第三行(
GROUP BY)的time ($interval)和fill (null)移除
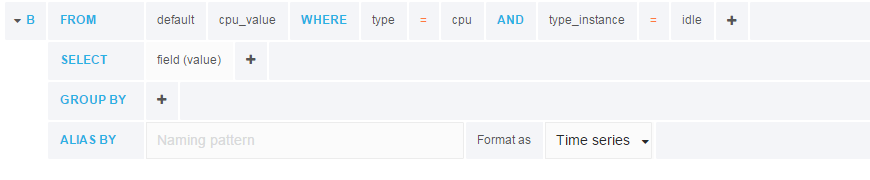
最终结果:
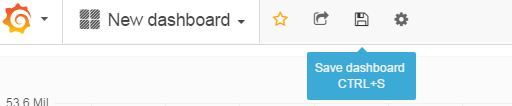
4) 保存Dashboard
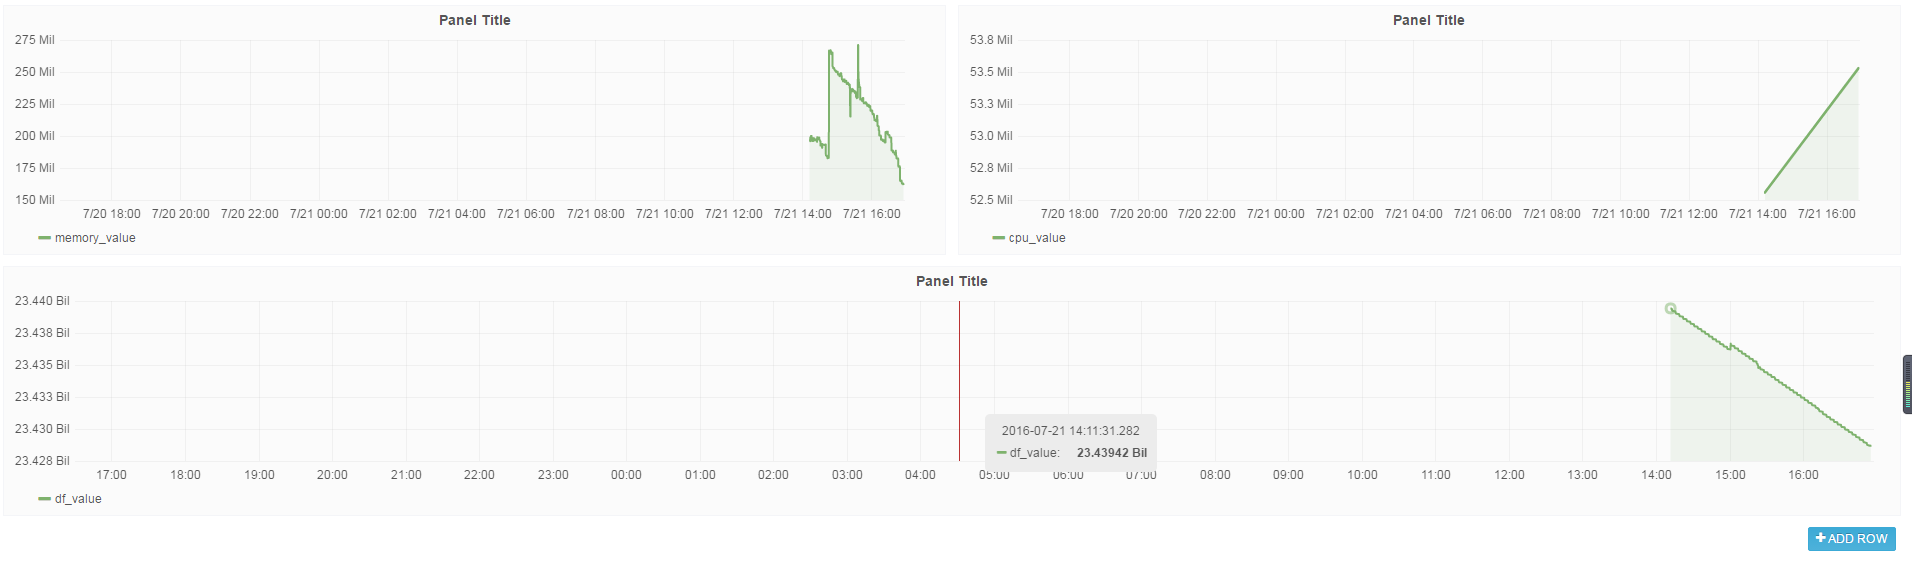
选择菜单栏中的新建的Dashboard,选择新建的Dashboard,就可以看到所有的数据图表了。
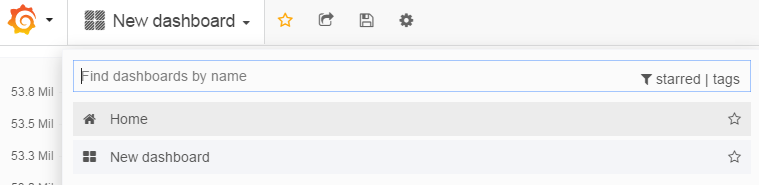
效果如下:
提取图片
点击Graph的名称,选择share,如下:
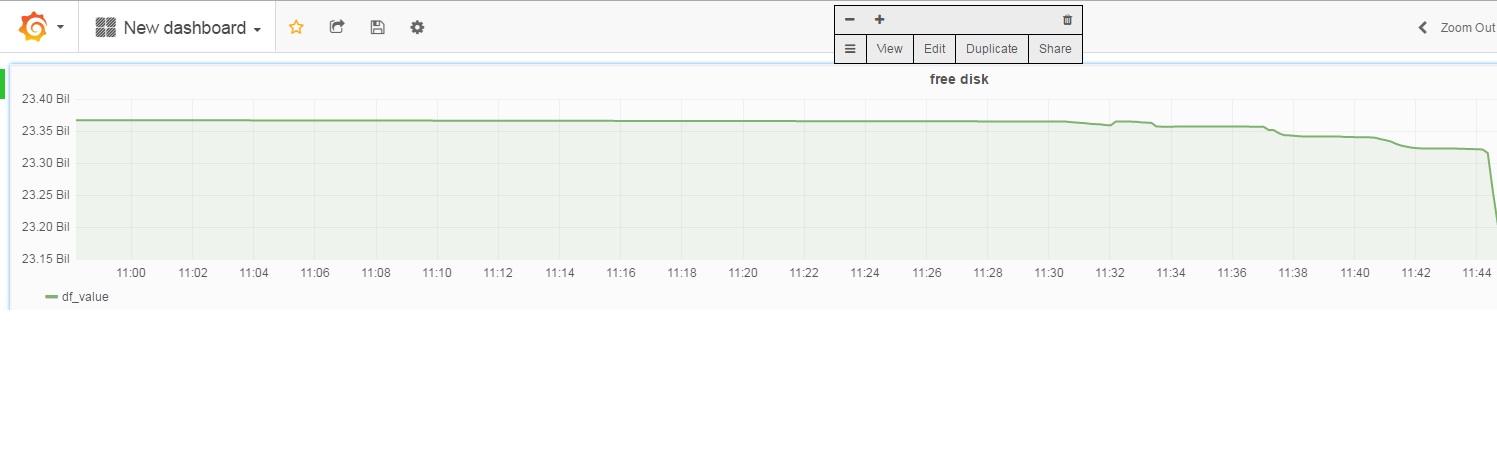
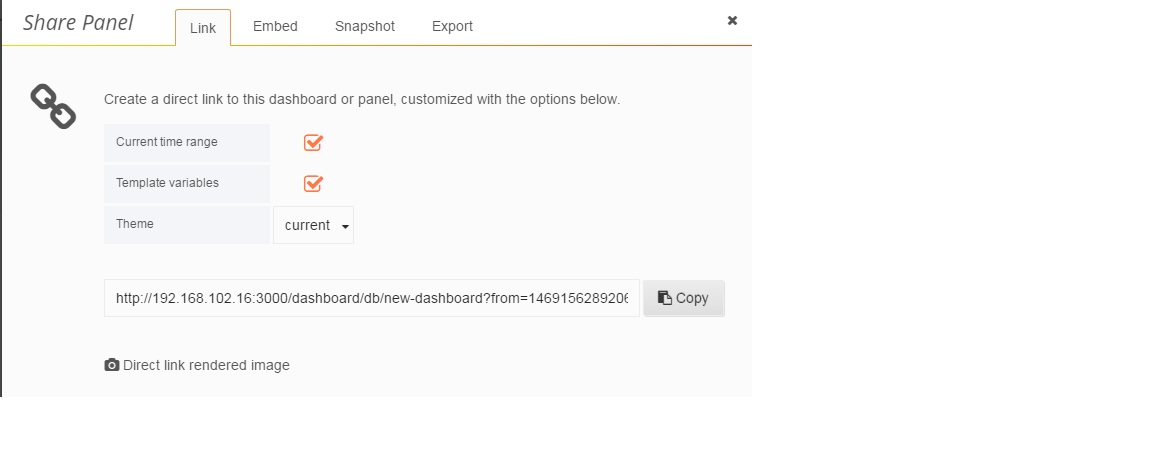
在Link页签中,包含了访问该图表的链接;在Embed中指明了通过iframe的方式,将该图表嵌入至其他页面的方式。
