@K1999
2016-06-25T10:13:19.000000Z
字数 5156
阅读 2306
R语言学习笔记
R
本文主要是自己在学习和使用R语言时对于一些不太熟悉的内容做一下记录,记录会随着学习和工作中遇到的问题而增加。
Start: Hello World
首先,用Hello world做个开头吧。
print("Hello World")
1 R语言的开发环境
1.1 下载R-CARN
R可以在CRAN([https://cran.r-project.org/][1])免费下载和使用。
1.2 工作空间
工作空间(workspace)就是当前R的工作环境,它储存着所有用户定义的对象(向量、矩阵、函数、数据框、列表等)。在一个R会话结束时,你可以将当前工作空间保存到一个镜像中,并在下次启动R时载入它,即可回到之前的工作状态中。
#设置当前工作空间> getwd() #显示当前的工作空间目录[1] "C:/Users/yigeng/RWorkSpace"> dir.create("helloworld") #在当前目录下创建一个文件夹> setwd("C:\\Users\\yigeng\\RWorkSpace\\helloworld") #设置当前工作目录> options() #显示当前工作空间设置> x<-(1,2,3) #创建一个向量x> q() #退出 提示是否保存工作空间,点击保存#返回工作空间> setwd("C:\\Users\\yigeng\\RWorkSpace\\helloworld")> load(".RData") #读取一个工作空间到当前目录中> x[1] 1 2 3 #看到之前工作空间中的数据x,说明工作空间加载正确
注1:在Windows下输入文件目录可以用setwd("C:\\Users\\yigeng\\RWorkSpace"),也可以用setwd("C:/Users/yigeng/RWorkSpace")。
注2:setwd()不会自动创建一个不存在的目录,所以先要用dir.create()创建目录。
1.3 包
用install.packages()可以看到所有的包的列表。
安装包
> install.packages("package_name") #package_name为要安装的包名
载入包
> library(package_name) #使用包之前要先载入
查看包的帮助文档
> help(package="package_name")
1.4 帮助文档
> help.start() #打开帮助文档首页> help("function_name")> ?function_name #同上,查看函数的帮助> example("function_name") #函数的使用示例> help.search("key_word")> ??key_word #以key_word为关键词搜索本地帮助文档
2 数据结构
2.1 向量(Vectors)
2.1.1 动态增加向量内容
film_list <- c("A New Hope", "The Empire Strikes Back", "Return of the Jedi")copy_list<-vector()for(i in 1:length(film_list )) {copy_list[i] <- film_list[i]}> copy_list[1] "A New Hope" "The Empire Strikes Back" "Return of the Jedi"
2.2 矩阵(Matrices)
2.2.1 创建矩阵
new_hope <- c(460.998, 314.4)empire_strikes <- c(290.475, 247.900)return_jedi <- c(309.306, 165.8)The_Phantom_Menace <- c(474.5, 552.5)Attack_of_the_Clones <- c(310.7, 338.7)Revenge_of_the_Sith <- c(380.3, 468.5)box_office <- c(new_hope, empire_strikes, return_jedi, The_Phantom_Menace, Attack_of_the_Clones, Revenge_of_the_Sith)all_wars_matrix <- matrix(box_office,byrow=TRUE,nrow=6)region <- c("US", "non-US")titles <- c("A New Hope", "The Empire Strikes Back", "Return of the Jedi", "The Phantom Menace", "Attack of the Clones", "Revenge of the Sith")colnames(all_wars_matrix) <- regionrownames(all_wars_matrix) <- titles> all_wars_matrixUS non-USA New Hope 460.998 314.4The Empire Strikes Back 290.475 247.9Return of the Jedi 309.306 165.8The Phantom Menace 474.500 552.5Attack of the Clones 310.700 338.7Revenge of the Sith 380.300 468.5
这样就创建了一个3*2的矩阵,记录了《星球大战》六部曲在北美和非北美地区的票房。
2.2.2 矩阵中提取元素
> all_wars_matrix[2,]US non-US290.475 247.900> all_wars_matrix[1:3,2]A New Hope The Empire Strikes Back Return of the Jedi314.4 247.9 165.8
2.2.3 两个矩阵相除
> ticket_prices_matrix #有一个票价矩阵US non-USA New Hope 5.0 5.0The Empire Strikes Back 6.0 6.0Return of the Jedi 7.0 7.0The Phantom Menace 4.0 4.0Attack of the Clones 4.5 4.5Revenge of the Sith 4.9 4.9> visitors <- all_wars_matrix / ticket_prices_matrix #票房和票价相除,可以得到观众数量> visitorsUS non-USA New Hope 92.20000 62.88000The Empire Strikes Back 48.41667 41.31667Return of the Jedi 44.18571 23.68571The Phantom Menace 118.62500 138.12500Attack of the Clones 69.04444 75.26667Revenge of the Sith 77.61224 95.61224>
2.3 因子(Factors)
2.4 数据框(Data frames)
矩阵主要用于存储相同数据类型的数据,数据框可以将不同类型的数据存储到一起。
2.4.1 数据框排序
> mtcars_sample <- mtcars[2:6,1:5] #mtcars数据集中提取几个样本> mtcars_samplempg cyl disp hp dratMazda RX4 Wag 21.0 6 160 110 3.90Datsun 710 22.8 4 108 93 3.85Hornet 4 Drive 21.4 6 258 110 3.08Hornet Sportabout 18.7 8 360 175 3.15Valiant 18.1 6 225 105 2.76> mtcars_sorted <- mtcars_sample[order(mtcars_sample$mpg,decreasing = F),] #mtcars_sample中的记录按照mpg排序,将排序后的数据框存储到mtcars_sorted中来> mtcars_sortedmpg cyl disp hp dratValiant 18.1 6 225 105 2.76Hornet Sportabout 18.7 8 360 175 3.15Mazda RX4 Wag 21.0 6 160 110 3.90Hornet 4 Drive 21.4 6 258 110 3.08Datsun 710 22.8 4 108 93 3.85>
2.5 列表(Lists)
3 逻辑运算
3.1 关系运算
3.1.1 向量的逻辑运算
> linkedin <- c(16, 9, 13, 5, 2, 17, 14)> linkedin > 15[1] TRUE FALSE FALSE FALSE FALSE TRUE FALSE> j <- c(linkedin > 15)> j[1] TRUE FALSE FALSE FALSE FALSE TRUE FALSE
向量和数字作比较,生成一逻辑向量,矩阵和数字作比较的结果一样,生成逻辑矩阵。
4 控制流与函数
5 画图
5.1 图形组合
R语言中,在par()函数中使用图形参数mfrow=c(nrows,ncols)来创建按行填充的、行数为nrows、列数为ncols的图形矩阵。用nfcol=c(nrows, ncols)可以创建按列填充矩阵。
attach(mtcars)opar <- par(no.readonly = TRUE)par(mfrow = c(2, 2))plot(wt, mpg, main = "Scatterplot of wt vs. mpg")plot(wt, disp, main = "Scatterplot of wt vs disp")hist(wt, main = "Histogram of wt")boxplot(wt, main = "Boxplot of wt")par(opar)detach(mtcars)
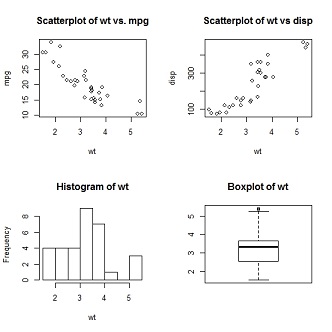
如上图所示,生成了一个2*2的图形矩阵。
还可以使用layout()来做布局,调用形式为layout(mat, widths, heights),其中mat为一个矩阵,主要用该矩阵设置窗口的划分,矩阵的0元素表示该位置不画图,非0元素必须包括从1开始的连续的整数值,比如:1……N,按非0元素的大小设置图形的顺序。
例如矩阵为:matrix(c(1,1,2,3,4,3),3,2,byrows=TRUE)得到一个三行两列的矩阵,形式如下:
> matrix(c(1,1,2,3,4,3),3,2,byrow=TRUE)[,1] [,2][1,] 1 1[2,] 2 3[3,] 4 3
那么我们得到如下形式的output device:

widths和heights两个参数用来控制每幅图形的大小。
widths = 各列宽度值组成的一个向量。
heights = 各行高度值组成的一个向量。
attach(mtcars)layout(matrix(c(1, 1, 2, 3), 2, 2, byrow = TRUE), widths = c(3, 1), heights = c(1, 2))hist(wt)hist(mpg)hist(disp)detach(mtcars)
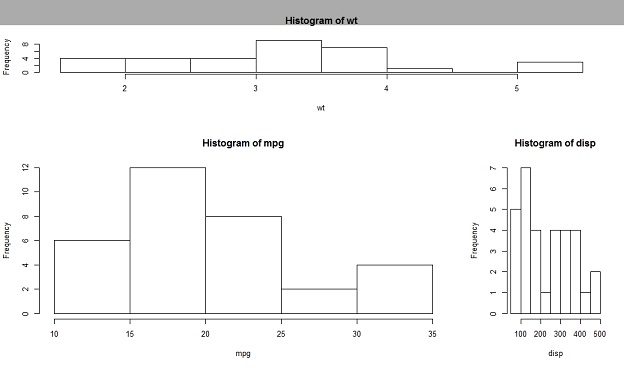
输出结果如上图所示,通过height的控制第1行中图形的高度是第2行中图形高度的二分之一。通过widths的控制右下角图形的宽度是左下角图形宽度的三分之一。
还有一种更精细的图形布局控制,用par()中的fig参数来控制,fig是一个向量。先看一下代码示例:
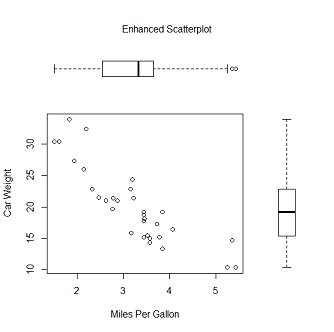
opar <- par(no.readonly = TRUE)par(fig = c(0, 0.8, 0, 0.8)) #设置散点图plot(mtcars$wt, mtcars$mpg, xlab = "Miles Per Gallon", ylab = "Car Weight")par(fig = c(0, 0.8, 0.55, 1), new = TRUE) #在上方添加箱线图boxplot(mtcars$wt, horizontal = TRUE, axes = FALSE)par(fig = c(0.65, 1, 0, 0.8), new = TRUE) #在右侧添加箱线图boxplot(mtcars$mpg, axes = FALSE)mtext("Enhanced Scatterplot", side = 3, outer = TRUE, line = -3)par(opar)
代码运行结果如下:
要理解这幅图的绘制原理,请试想完整的绘图区域:左下角坐标为(0,0),而右上角坐标为(1,1)。
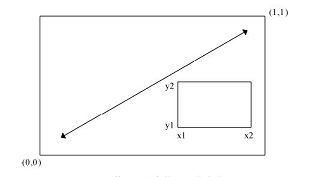
上图是一幅示意图。参数fig=的取值是一个形如c(x1, x2, y1, y2)的数值向量。第一个fig=将散点图设定为占据横向范围0~0.8,纵向范围0~0.8。上方的箱线图横向占据0~0.8,纵向0.55~1。右侧的箱线图横向占据0.65~1,纵向0~0.8。fig=默认会新建一幅图形,所以在添加一幅图到一幅现有图形上时,请设定参数new=TRUE。
这里将参数选择为0.55而不是0.8,这样上方的图形就不会和散点图拉得太远。
参考资料
DataCamp
R语言实战/(美)Kabacooff,R.I.著
